QMENTA User Manual
About this User Manual
Terms
Analysis: A single analysis or workflow of sequential analyses which can be executed in the QMENTA Platform (e.g., FreeSurfer, Protocol Adherence Automation, etc.).
Audit Trail: A detailed, chronological record of all actions and events executed within QMENTA Trials.
Metadata: Numerical and qualitative data associated with a Subject ID/Session ID in a project in QMENTA Platform(e.g., visit date, clinical scores, corticosteroid, etc…).
Modality: A label automatically or manually added to a data file in the QMENTA Platform. It corresponds to the imaging modality of the data file in the broad sense (e.g., CT, PET, DTI, T1, T2, etc…). Refer to section Medical Imaging Classification for the complete list of imaging modalities supported by the QMENTA Platform.
QMENTA Platform: A browser-based software where users can upload medical data and execute analyses, among other functionalities. Also referred to as Platform.
Project: The imaging data and the corresponding analyses are organized by Project in the QMENTA Platform. Each Project is a separate entity and information is not shared across Projects.
Roles: Predefined sets of permissions and responsibilities assigned to users of the QMENTA Platform. These roles determine what actions a user can perform and what data or features they can access.
Session ID: Numerical identifier of an imaging session associated with a participant (Subject ID) in a QMENTA Platform project. The pair Subject ID/Session ID uniquely identifies every imaging session in a QMENTA Platform Project.
Subject ID: Unique identifier for a participant in a QMENTA Platform project.
Tag:
A label manually attached to a specific pair Subject ID/Session ID.
A label automatically or manually added to a data file uploaded to the QMENTA Platform.
Timepoint: An imaging session acquired at a specific moment in time. On QMENTA Platform, this corresponds to a Subject ID/Session ID and may include Metadata.
Tool: A singular analysis component executed in the QMENTA Platform, as a standalone analysis or as part of a workflow.
Workflow: A sequence of image processing analyses executed in the QMENTA Platform.
Abbreviations
2FA: Two-factor authentication
CT: Computed Tomography
DICOM: Digital Imaging and Communications in Medicine
DTI: Diffusion Tensor Imaging
DWI: Diffusion Weighting Images
FLAIR: Fluid-attenuated inversion recovery
fMRI: Functional Magnetic Resonance Imaging
GB: Gigabyte
MB: Megabyte
MRI: Magnetic Resonance Imaging
MS: Multiple Sclerosis
NIfTI: Neuroimaging Informatics Technology Initiative
PACS: Picture Archive and Communication System
RAM: Random Access Memory
ROI: Region of Interest
PD: Proton density imaging
PHI: Personal Health Information
QA: Quality Assurance
QC: Quality Control
T1: T1-weighted image
T2: T2-weighted image
ZIP: An archive file format
Overview
The following user manual outlines the principles of the QMENTA Platform for general usage.
The manual follows a general clinical imaging data workflow describing all the features of the QMENTA Platform. It includes steps such as creating and joining a project, uploading data, executing analysis and QCing data, among others.
The QMENTA Platform is a web-based cloud software that runs in your browser.
If you run into any issues or have questions in the context of this manual or when using the QMENTA environment, please do not hesitate to contact QMENTA’s support via support@qmenta.com.
QMENTA Platform
The QMENTA Platform is a global, secure, and compliant solution to aggregate, store and process medical imaging data with the double purpose to enhance efficiency and enable collaboration in clinical studies as well as to facilitate research and development of imaging analyses. In the context of this pilot study, it will be utilized to perform the following:
Data upload, classification, and management.
Assessment of the protocol adherence.
Execution of imaging analyses.
Analysis management.
Metadata management, statistics, and database filtering and querying.
Target audience
This document is intended for medical imaging experts, qualified physicians, hospital staff, researchers, radiologists, developers, and project managers. Users are assumed to have a foundational knowledge of medical imaging.
System requirements
The QMENTA Platform needs:
Computer with internet connection.
Supported Browser: Latest version of Google Chrome.
Language supported: English.
The following requirements are recommended in order to provide an appropriate user experience:
Internet speed: 300 Mbps download / 100 Mbps upload (minimum recommended 100 Mbps / 50 Mbps)
Minimum RAM of your computer: 4 Gb (16 Gb recommended).
Minimum screen size: 1920x1080.
Operating system: Windows, Linux or Mac.
For CT, MRI, PET-CT client side MPR/MIP rendering: 64 bit CPU and 64 bit operating system.
Getting Started
Creating an account
In order to create an account you have to visit the QMENTA Platform website: https://platform.qmenta.com/#/register. You can sign up on the QMENTA Platform by entering your email and password in the form (Fig. 1). The password should be at least 8 characters long, and contain 1 uppercase, 1 lowercase, 1 digit and 1 special character (@#$%&!?*).
After filling in the mandatory fields, and confirming the terms and conditions, press “continue”.
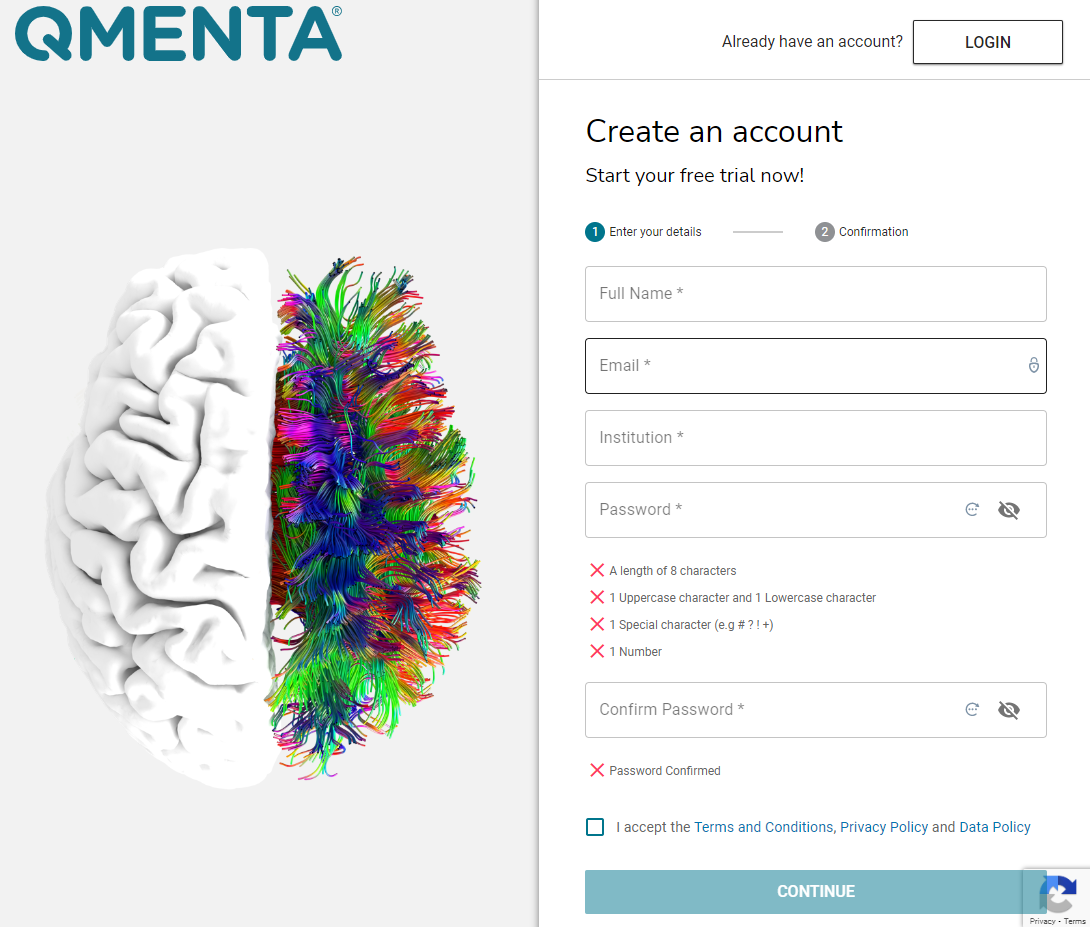
Fig. 1 Registration form for the QMENTA Platform.
In the next window, you will be asked if you are part of an existing study active in the QMENTA Platform. If you were given a project activation code by QMENTA or the project coordinator of your study, please select “Yes” on Fig. 2, enter the activation code (Fig. 3) and click “Register with Code”. This will automatically grant you access to the corresponding project in the QMENTA Platform associated with the study. This access will already be given with the roles and permissions defined to you by your project coordinator.
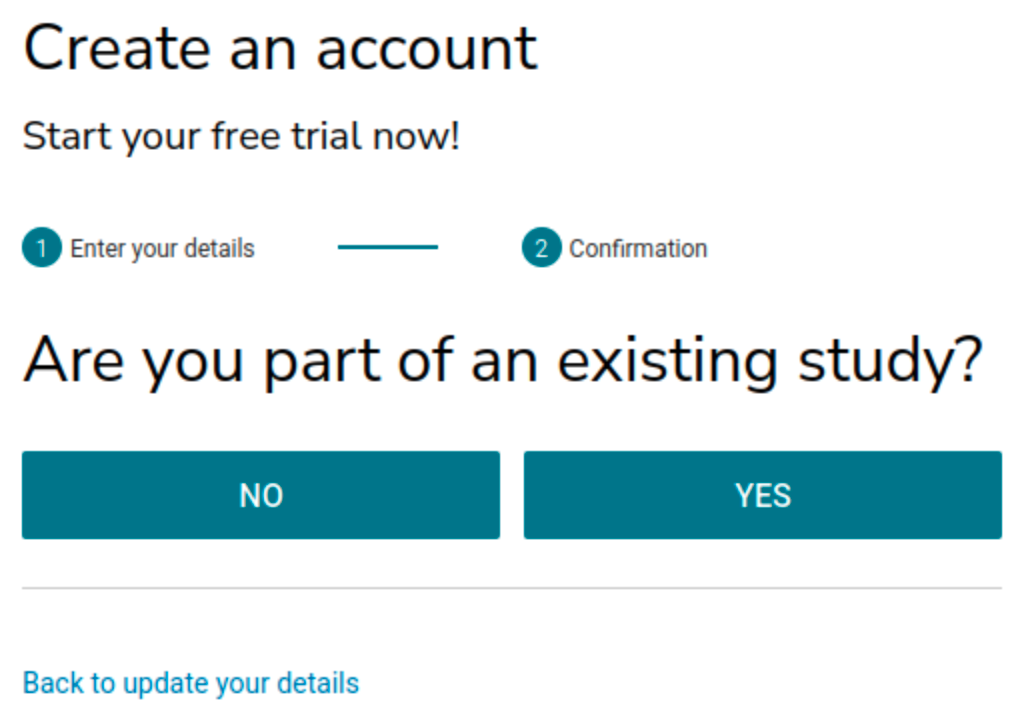
Fig. 2 Prior to proceeding with the registration you must say whether you are part of an existing study or not. If so, an activation code will be requested.
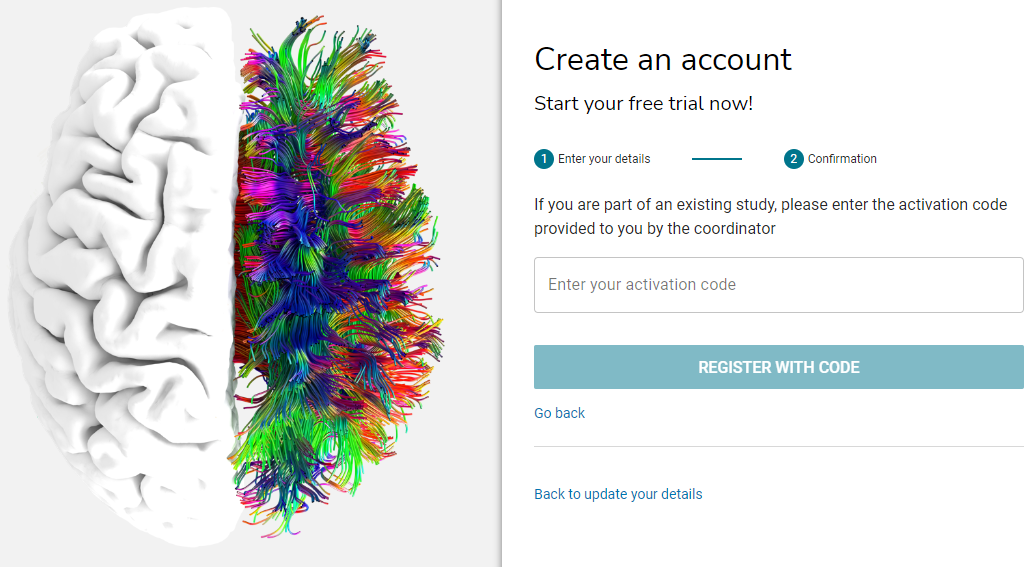
Fig. 3 Registering with an activation code into the QMENTA Platform. Insert the activation code in the corresponding field and click “Register with Code”.
In the case you are not part of an existing study, after clicking “No” on Fig. 2 you will be asked to book an activation call. Please select a date and time (Fig. 4) and the QMENTA team will onboard you to the QMENTA Platform.
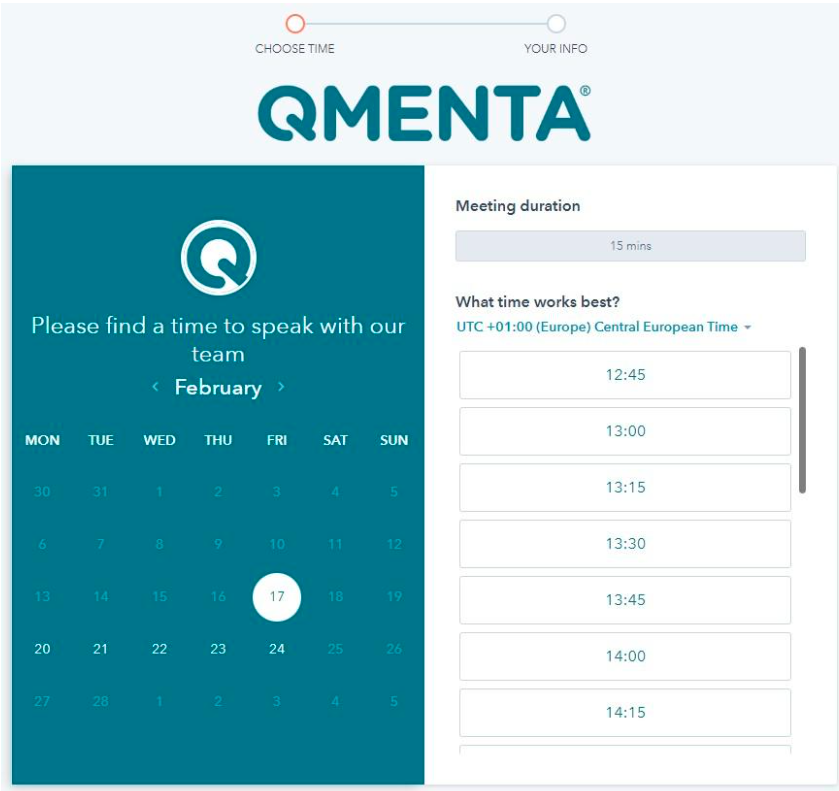
Fig. 4 Booking an activation call window.
After completing the registration form, either via an activation code or booking a call, you will receive an activation email with the subject: “Your account is activated”. Click the link in the email to activate your account. If you do not receive the email, please contact the project coordinator or the QMENTA team directly at support@qmenta.com.
Signing in
Using your web browser, navigate to the QMENTA Platform website: https://platform.qmenta.com
The login page will appear if you are not already logged in. You will be asked to input your email and password used in the registration process (refer to section Creating an account). After filling in the required fields, click the “LOGIN” button.
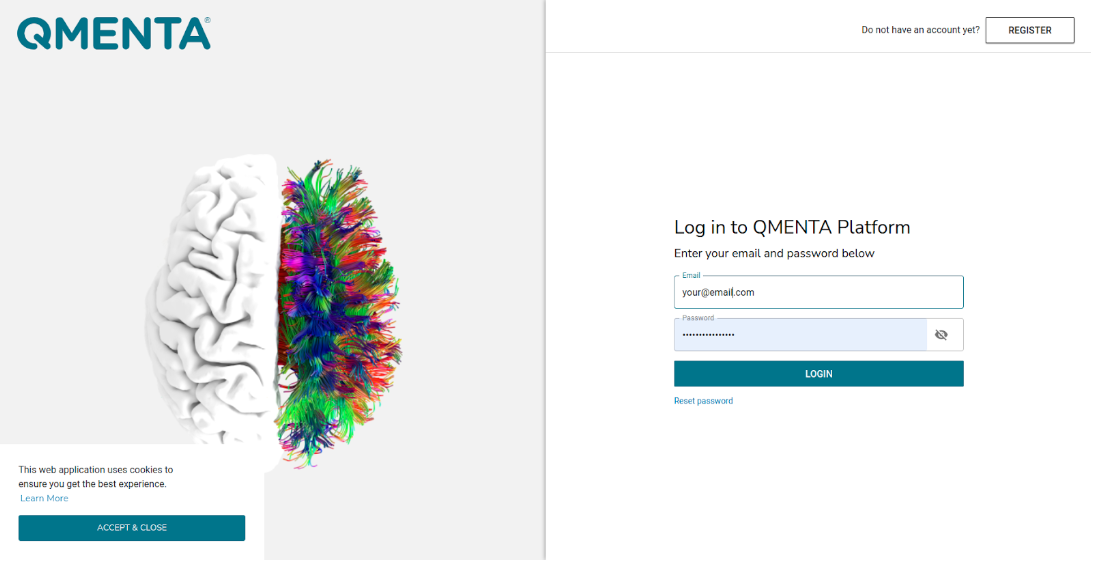
Fig. 5 QMENTA Platform log-in window.
If 2-factor authentication (2FA) is enabled for your account, at this point you will be asked to enter the verification code sent to your mobile phone. For details on how to enable/disable 2FA, see section 2-Factor Authentication.
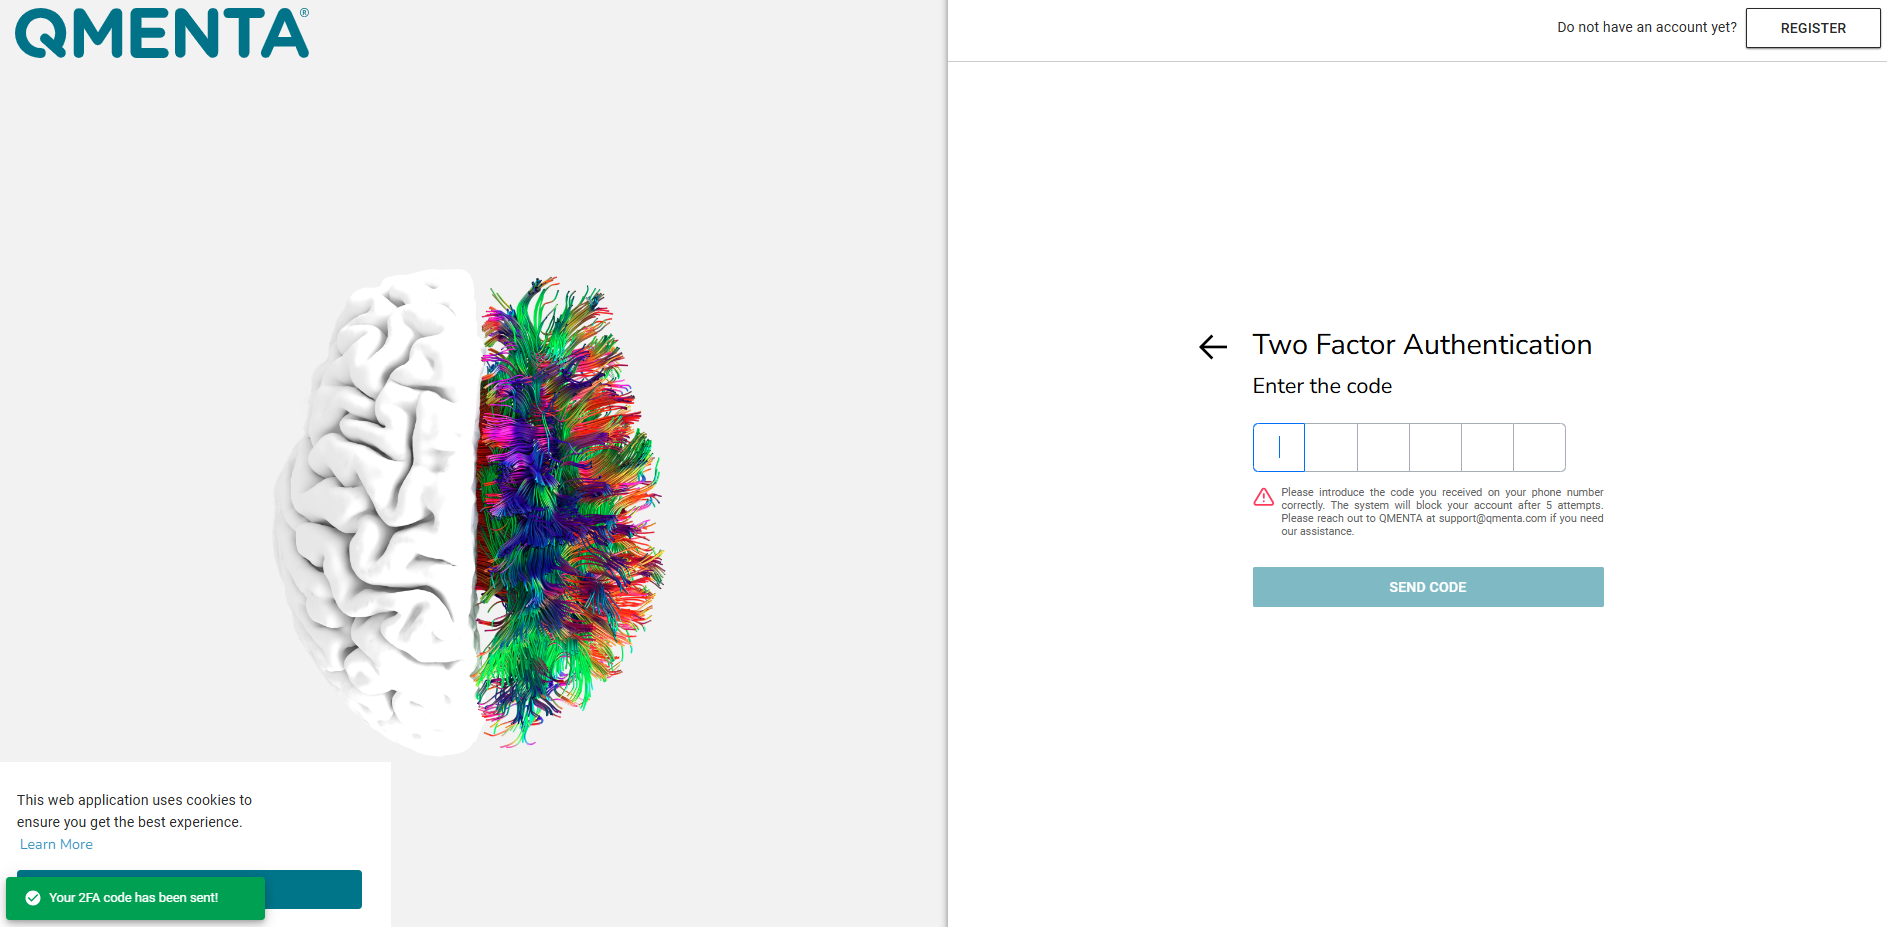
Fig. 6 Enter 2-Factor Authentication window.
Note
If it is your first time signing into the QMENTA Platform, you will be greeted with a “Welcome to the QMENTA Platform” pop-up. By clicking “Start the tour”, you will be presented with a whistle-stop overview of the platform, including some of the features described in this manual. You can access this tour again at any time by clicking “Platform Overview” in the Tutorials section of the dashboard.
Dashboard
Once signed in to the QMENTA Platform, you will land on the dashboard page which looks similar to Fig. 7.

Fig. 7 The Dashboard shows you a summary of the data in the activated project (i.e., “Current project”). On the right-hand side under “My Projects” you can see all the projects you are involved in. To activate any project click on its name on the list.
On the right-hand side of the Dashboard you have the list of projects you have access to (“My Projects”). The first project in the list is the active one, which is also shown on the middle of the page next to: “Current project”. On the list of projects:
You can hover the mouse over the project name to see the unique identification number of the project.
The initials to the right of the project name indicates your role.You can hover the mouse over the initials to see your exact role (PM: Project Manager in the active project of Fig. 7).
If your role is one of:
“Owner” or “Project Admin”, you can click the “Config” key and edit the project details as explained in Projects. With these roles you can also invite collaborators and/or modify their roles. See more about roles in section Roles for Roles for Standard type of project.
“Collaborator”, “Data Admin” or “Guest” you can click the “Info” key and visualize certain project information such as the participants, the description, and the project duration.
In the middle of the Dashboard you can see basic information about the current active project such as: number of subjects, sessions, and analyses executed. A pie-chart with the modality distribution within the project is available.
Clicking “Upload Your Data”, a pop-up window will appear where you can drag and drop a zip file to be uploaded to the active project. See further information in chapter (refer to Data Upload).
At the bottom of the page, there are links to additional tutorials covering the basic usage of the QMENTA Platform and certain policy information. Further below, there is also “Setup Progress”. That is, a set of steps you have completed so far towards fully setting up your account in the QMENTA Platform.
On the left sidebar on the dashboard, you can find the QMENTA logo alongside five clickable icons:
“Data”: The folder icon. This will open a new tab where you can manage the active project data. This is explained in detail in section Data Upload.
“Analyses”: The flask icon. This will open a new tab where you can manage the active project analyses. This is explained in detail in the Analysis Management section.
“Activity”: The sawtooth line. This will open a pop-up window with a list of ongoing activities your user is currently performing in the QMENTA Platform. These can be from uploading data to deleting analysis
“Support”: The human icon. This will open a chat window where you can contact QMENTA’s support team in real time during business hours (CET).
“Alerts”: The bell icon. This will open a new tab (‘Notification Center’) showing a list of notifications, such as updates regarding the QMENTA Platform or password reset reminders.
In the top right corner, “My Profile” will open a new browser window where you can edit your user information. For more on this, see section Managing your Account.
Finally, you can logout of the Platform by clicking the “Logout” link in the top right corner.
Managing your Account
Once logged into the QMENTA Platform, you can manage your user account by clicking “My Profile” in the top right corner of the dashboard. This will open a new browser tab - please ensure that pop-ups are allowed by your browser for the QMENTA Platform.
This new tab comprises the following sections:
My Data
In this tab (Fig. 8) you can modify your name and/or institution.
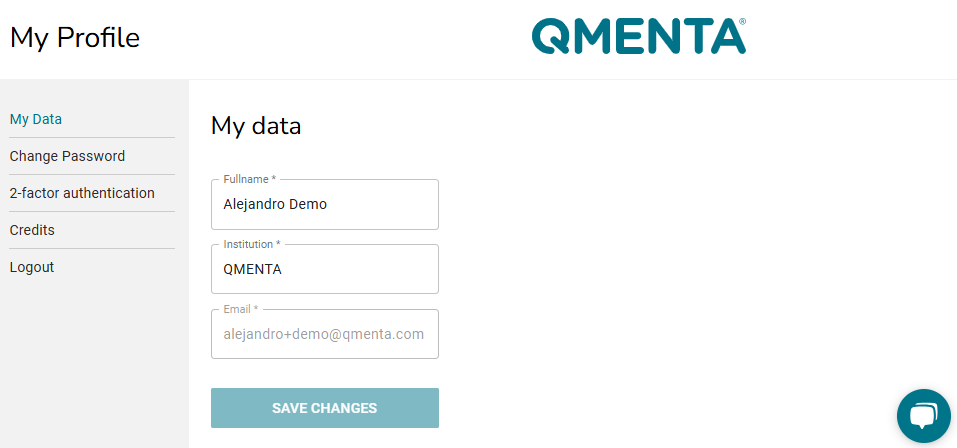
Fig. 8 My data allows you to edit your name and institution.
Change Password
In this tab (Fig. 9) you can change your password. Note that the password needs to be changed every 3 months. If not, your user will be deactivated. Four automatic e-mail reminders will be sent to notify you that your password needs to be changed. These e-mails will be sent 30 days, 14 days, 7 days and 1 day before the system locks your account.
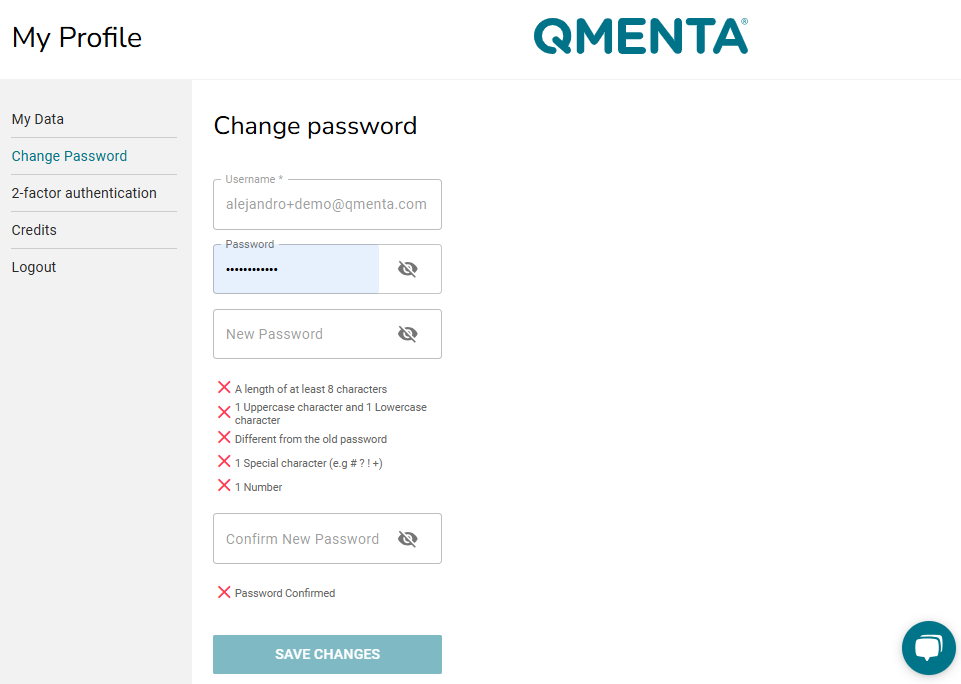
Fig. 9 Change Password tab.
Note
In the event that your account is locked, simply click “Reset Password” in the sign-in page and follow the instructions
2-Factor Authentication
In this tab (Fig. 10) you can enable or disable 2FA. Note that when enabling 2FA, it is mandatory to include a phone number in order to receive the SMS code requested when signing in to the QMENTA Platform.
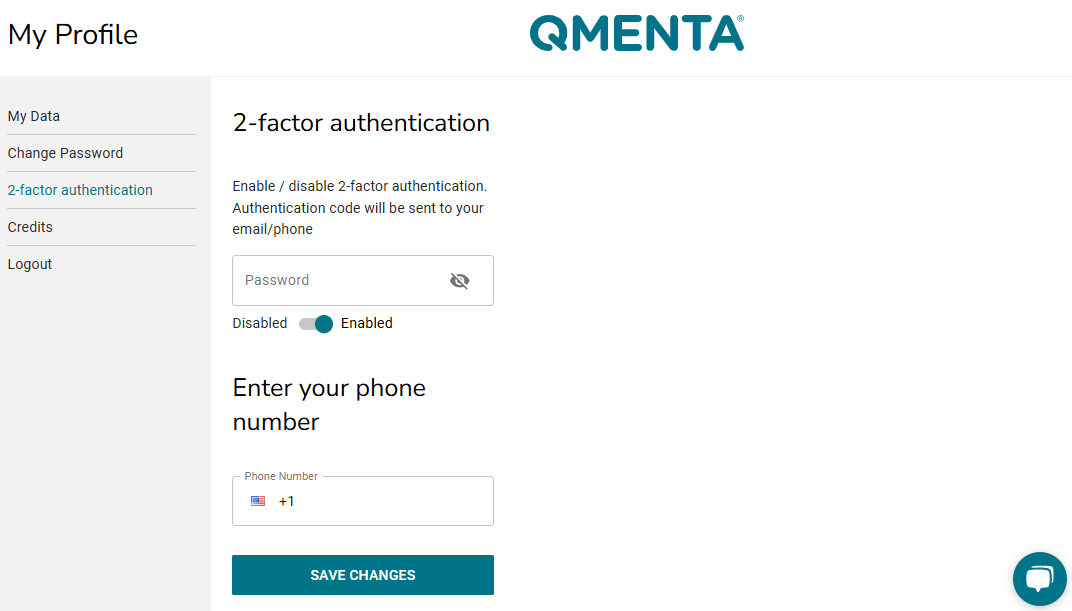
Fig. 10 2FA can be enabled so you receive a code via SMS for authentication when logging into the QMENTA Platform.
Credits
In this tab (Fig. 11) you can see a summary of your available credits. Credits act as a kind of ‘currency’, enabling you to perform certain actions within the QMENTA Platform.
“Upload Quota” refers to the quantity of GB granted to your user to upload data to the QMENTA Platform.
“Analysis Credits” refers to the number of analyses that your user can execute in the QMENTA Platform.
“Analysis Run in Parallel” refers to the maximum number of analyses that your user can run simultaneously in the QMENTA Platform.
This tab is merely informative. If you wish to be granted more quota, credits or parallel analyses, please contact QMENTA support via support@qmenta.com.
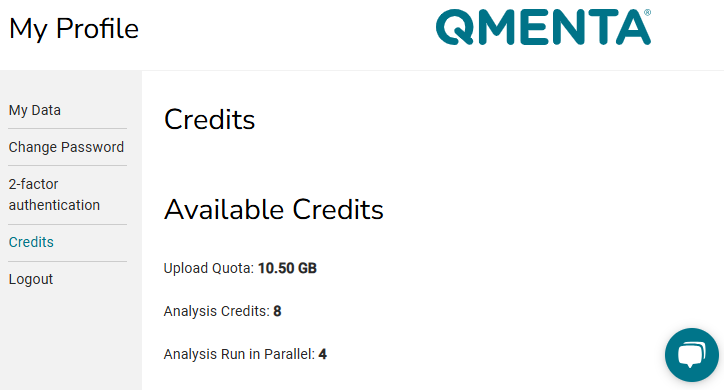
Fig. 11 The credits view shows your current upload quota, analysis credits, and the maximum number of analyses that you can run in parallel.
Projects
The projects in the QMENTA Platform are different entities where the medical imaging data is uploaded to and where analyses are executed. All the projects available in the QMENTA Platform are independent, and they can have different data and analyses accessible as well as different collaborators. Further, collaborators will have a different set of permissions as decided by the administrator of the project.
Throughout this chapter, you will learn all the project-level functionalities available within the QMENTA Platform.
Creating a Project
To create a new project in the QMENTA Platform, in the Dashboard go to the bottom of the “My Projects” list and click on the “+ Create New Project” label under the list (Fig. 12).
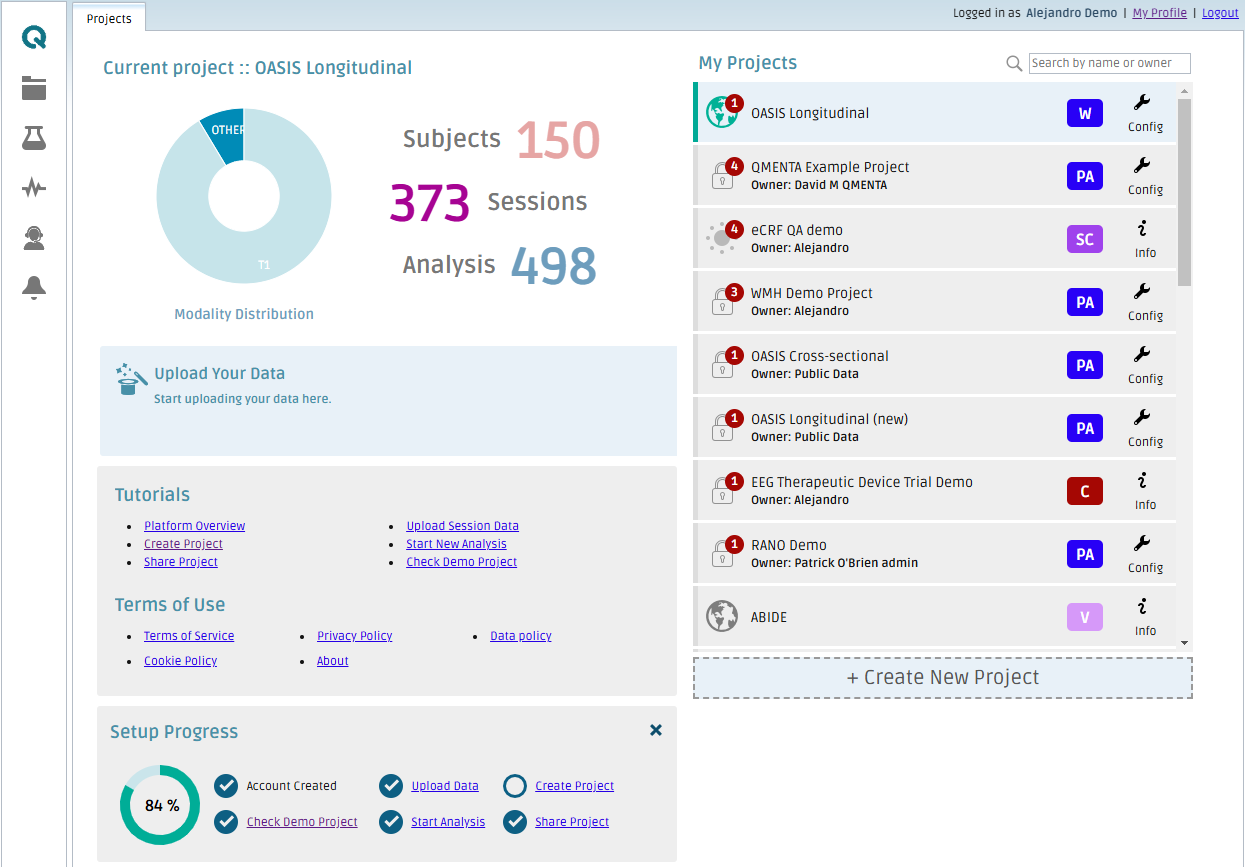
Fig. 12 In the Dashboard click “+ Create New Project” to pop-up the “Create New Project” window.
The “Create New Project” pop-up window will appear (Fig. 14). In this window, you will need to fill in the required fields of the new project. These are:
“Name”: Name of the project.
“Abbreviation”: Abbreviation of the project.
“Project Type”: Only the “Standard” option will be available. In case other types of projects are needed please contact QMENTA support via support@qmenta.com.
“Data location”: Location of the dedicated server to store the data that is uploaded to the project.
“DICOM anonymization”: Only the “Strong” option will be available. For further details refer to this article. In case you need to define another type of anonymization please contact QMENTA support via support@qmenta.com.
“Measure of age”: The age of subjects will be displayed in the project in either months or years. Note the age of the subject will be extracted automatically if available in the uploaded DICOM data. The age is not extracted for other uploaded data types.
Note
QMENTA personnel can create new projects in which the DICOM anonymization is disabled upon request.
In the “Share Data” area, you can invite collaborators to the newly created project. Write the e-mail of the collaborators, select a role (Roles for Standard type of project) from the drop down and a data location. The default data location will be the same as the one defined at project level, but it can be modified for specific collaborators. Finally check the “QA” checkbox if you want to grant the collaborator permission to perform Quality Assurance tasks such as modifying the QC Status of data sessions and analyses (QC Status) or execute the Protocol Adherence Automation analysis (Automatic QC Status Modifications).
If the invited collaborator is already registered in the QMENTA Platform, they will immediately have access to the project. However, if the collaborator is not yet registered in the QMENTA Platform, the pop-up window shown in Fig. 13 will appear. By clicking “OK”, the collaborator will receive an e-mail with the subject “You are invited to QMENTA!” which will instruct them on how to register to the QMENTA Platform as explained in section Creating an account. Upon the collaborator’s successful registration, you can proceed to add them to the desired project.
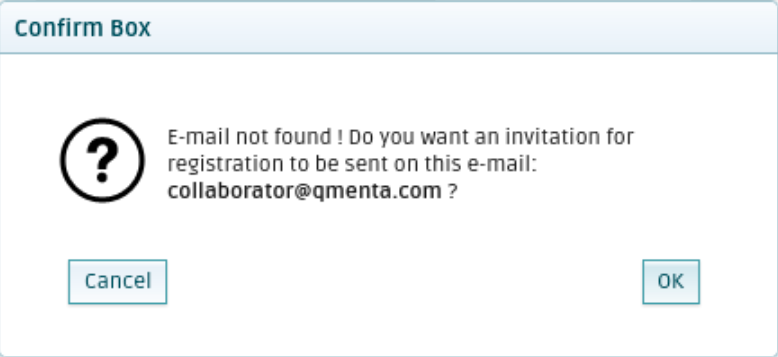
Fig. 13 The pop-up window indicating the new collaborator is not registered in the QMENTA Platform. Press “OK” to send a registration invitation.
In the second tab of the “Create New Project” pop-up window you can add a description of the project.
Then, click on “Create Project”. The new project will automatically be activated after creation and loaded into your Dashboard. Now, you can start working on the project: uploading data, QCing, running analyses etc… as explained in the corresponding sections Data Upload, QC Status and Starting an Analysis
By default your role in the new created project is “Owner”.
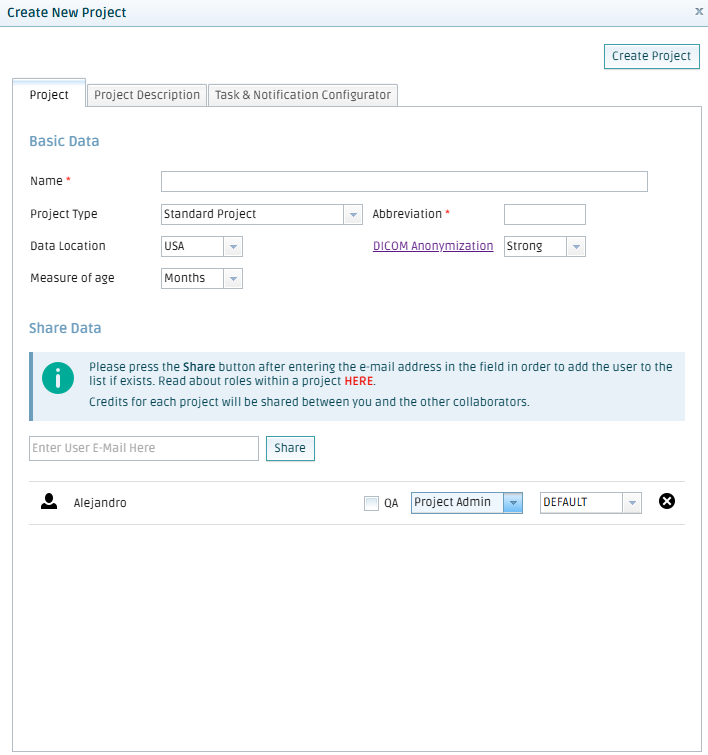
Fig. 14 Pop-up window to create a new project. Choose a name, abbreviation, fill the other options and add collaborators to the project.
Note
In the new project you create some of the analyses available in other projects might not be present. If you encounter any limitation, please contact QMENTA at support@qmenta.com to guarantee the project is correctly set up.
Roles for Standard type of project
QMENTA Platform supports different types of projects depending on their complexity. The basic structure is the “Standard” project and comprises the following roles:
An “Owner” or “Admin” manages an entire project.
A “Data Admin” manages all data within the project.
A “Collaborator” is invited to contribute to the project with restricted permissions.
A “Guest” can browse analysis results within the project.
Role |
Include/ Exclude Users |
Assign Roles |
Manage All Data |
Access Data (View/ Download/ Visualize) |
Edit/ Delete/ Analyze Own Data |
Other |
|---|---|---|---|---|---|---|
Owner |
Yes |
Yes |
Yes (view, create, edit, delete data, run analyses) |
Yes |
Yes |
Cannot be removed from the project |
Admin |
Yes |
Yes |
Yes (view, create, edit, delete data, run analyses) |
Yes |
Yes |
|
Data Admin |
No |
No |
Yes (view, create, edit, delete data, run analyses) |
Yes |
Yes |
|
Collaborator |
No |
No |
No |
Yes |
Yes |
Can only edit, delete or analyze their own data |
Guest |
No |
No |
No |
Yes |
No |
Project Data Insights
Project Quality
You can visualize a summary of all the information contained within a project. There are various ways to inspect the summary statistics of a project. First, in the middle of the dashboard (Fig. 15), there is a pie chart titled “Modality Distribution” showing the modality statistics of all the files uploaded to the active project. If you hover over each slice (modality) of the pie-chart, you will see the total number of files associated with that modality. To its right, there is the number of subjects, sessions, and analyses executed in the active project.
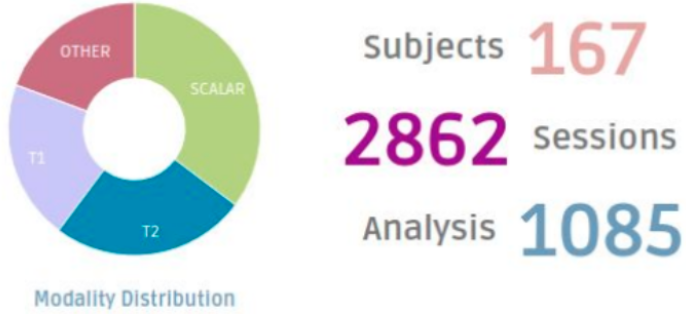
Fig. 15 Example dashboard project information.
Another way to inspect a project’s contents is by going to the “Data” tab then clicking “Data Insights > Project Quality” at the top of the table as shown in Fig. 16.
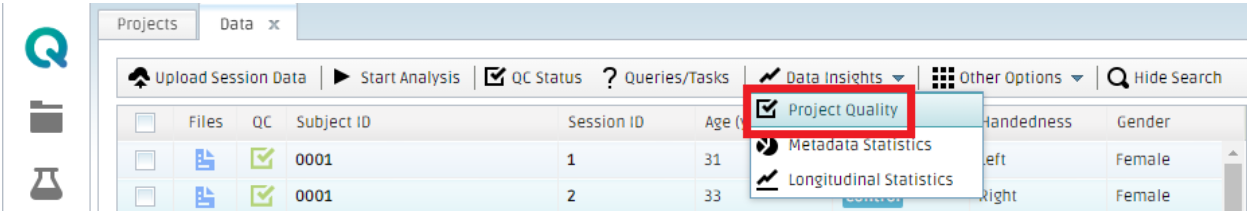
Fig. 16 Accessing the “Project Quality” tab.
This will open a new tab in the QMENTA Platform (Fig. 17)
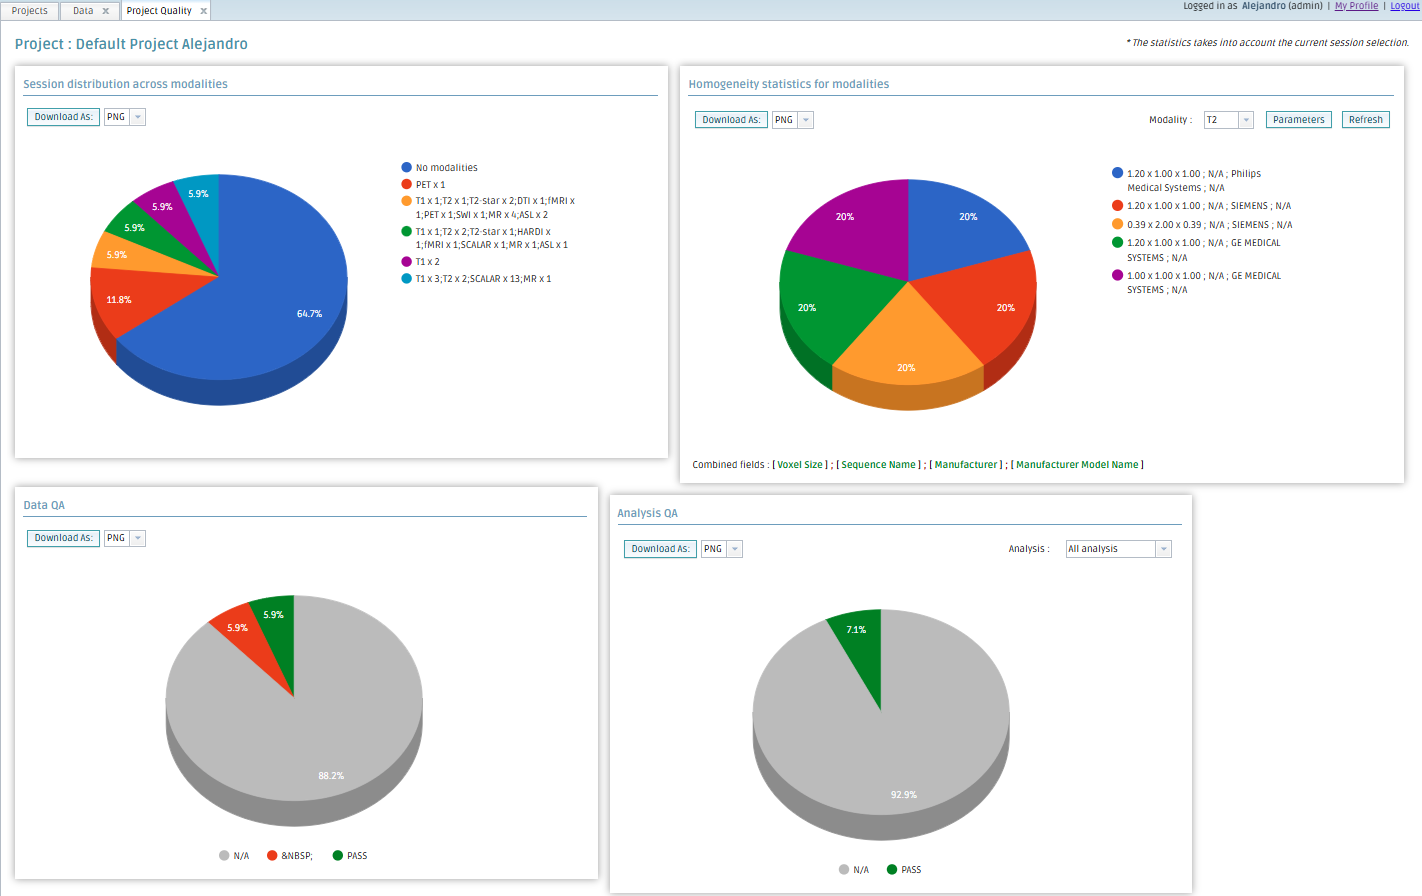
Fig. 17 The Project Quality tab shows four different pie charts with information about the active project.
In this view, four different pie charts are shown:
“Session distribution across modalities”: Distribution of modalities in the active project grouped by different sessions that have the same modality combination. Here, you can determine the proportion of sessions within the project that have all the modalities specified as required inputs for the analyses of interest. Example shown in Fig. 18.
“Homogeneity statistics for modalities”: Homogeneity of the data within each modality, grouped by some parameter(s) (e.g. Voxel Size). Here, you can determine the proportion of uploaded data (by modality) with a particular imaging characteristic.
“Data QA”: Percentage of PASS and FAIL sessions grouped by the QC Status (QC Status). N/A means the QC Status has not been assessed.
“Analysis QA”: Percentage of PASS and FAIL analysis grouped by the QC Status (Analysis QC). N/A means the QC Status of the analysis has not been assessed.
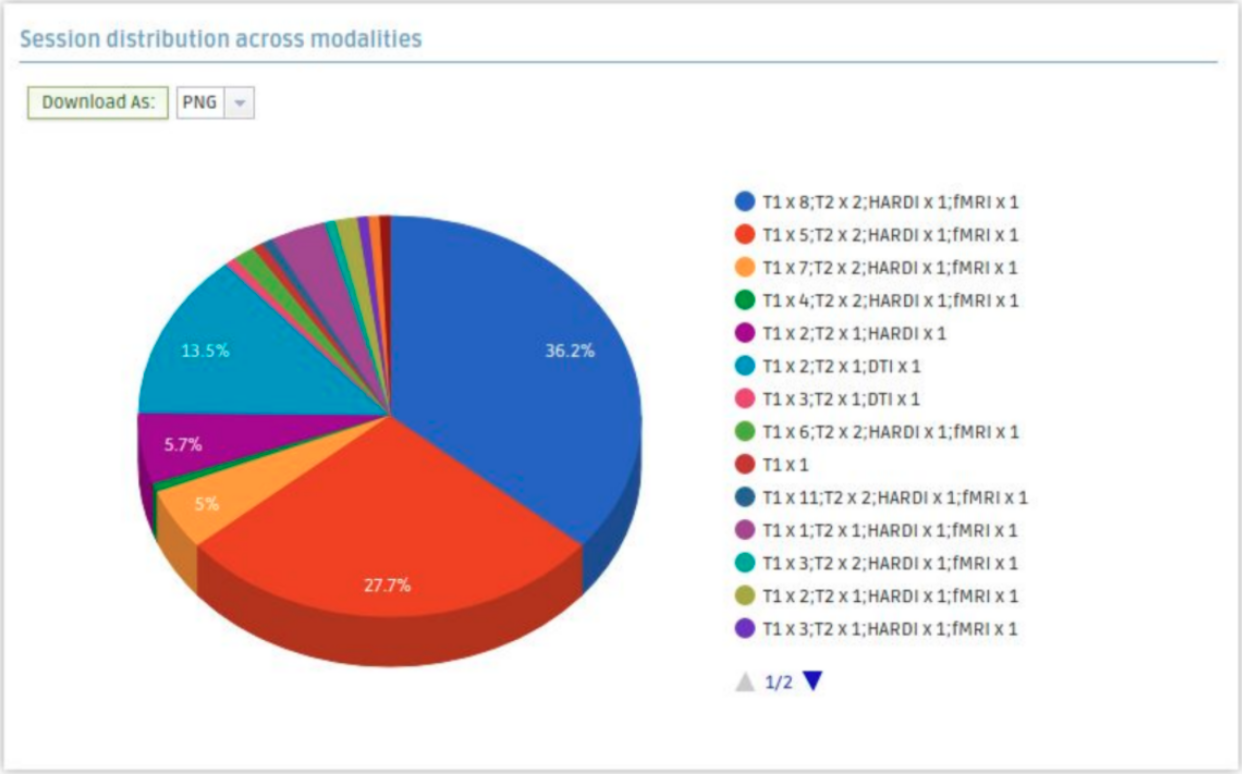
Fig. 18 Session distribution across modalities pie chart.
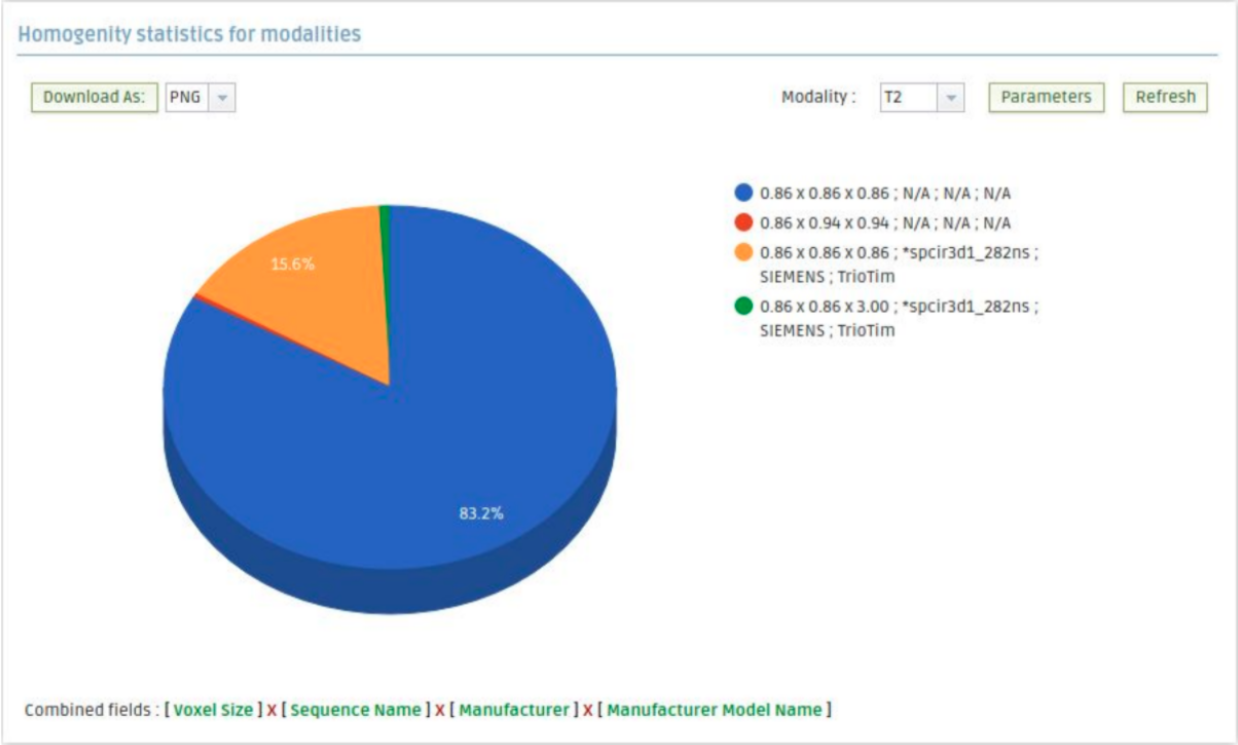
Fig. 19 Homogeneity statistics for modalities pie chart. Select a modality and parameter combination to assess how homogeneous your data is.
Other Options
Copy, Move, Edit and Delete Sessions
It is possible to move or copy data sessions from the active project to another project in which you
are collaborators as long as you have the manage data permissions that allow it in both
projects (table_rows). If you move data
sessions, the data will be deleted from the active project. If you copy the data sessions, the sessions
will be available in both projects.
Note
The executed analysis and their results are not copied or moved across projects when copy or moving their input data sessions.
To copy or move data across projects you have to select the desired data sessions, click on “Other Options” on the top menu and then select “Copy Session To …” or “Move Session To …” as shown in Fig. 20. Next a list of the available projects in which you can copy/move the data sessions will appear. This is a list of projects in which you are a collaborator.
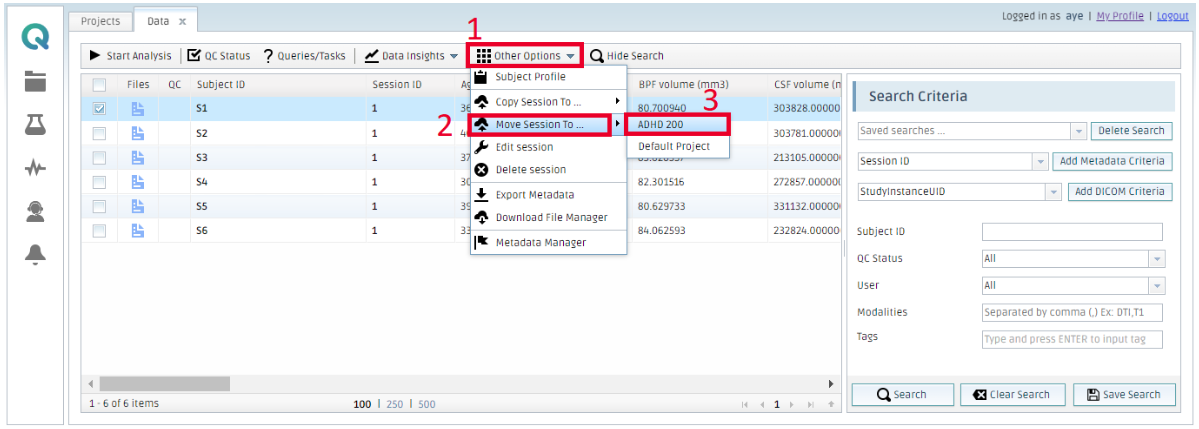
Fig. 20 Move data session across projects.
Note
Copying data sessions across projects is not instantaneous as the data needs to be duplicated.
Data Upload
Introduction
The Medical Image Data analysis is an in-house implemented analysis in the QMENTA Platform that allows you to upload a variety of medical imaging data formats (as well as other data types) to the QMENTA Platform in an efficient, structured and compliant manner. Within the various processing steps of the analysis, extensive sets of metadata are extracted from the uploaded files to facilitate their classification. Overall, the Medical Image Data analysis makes the data management process within the QMENTA Platform as seamless as possible.
Preparing Data for Upload & Starting the Medical Image Data analysis
Prior to upload, it is required that the data be compressed into a ZIP file. This reduces the data transfer time from your local computer to the QMENTA Platform. Note that certain file types (e.g., DICOM) can be very large if uncompressed.
The Medical Image Data analysis can be started in three different ways, each of which will be explained in later sub-sections.
Automatic Steps Performed by the analysis
The following steps are automatically performed in all executions of the Medical Image Data analysis:
Virus scanning: A check for viruses within the uploaded ZIP file. If a virus is present, all the data within the ZIP file is immediately deleted and you will be warned via the QC Status as explained in the section QC Status.
De-identification: Only applicable to DICOM files. The PHI present within the DICOM headers is removed following the criteria explained in this QMENTA Knowledge Base article. Skipping the de-identification step is also possible per QMENTA Project upon request. Note that PHI included in PDF Reports, directory names, file names, or text within the images themselves are not removed. It is your responsibility to remove this PHI.
File type recognition: Recognition of the individual files included in the ZIP file. An extensive list of supported file types is included in this QMENTA Knowledge Base article. Non-supported files will not be classified.
Metadata extraction: Extraction of extensive sets of metadata from the header of the uploaded files.
Harmonization: Only applicable to DICOM files. The metadata extracted from the DICOM headers of different manufacturers is harmonized.
Classification: Performs the classification of each medical imaging file. This classification is primarily based on the metadata extracted in previous steps, on the name of the file, and on a deep learning classifier based on the image intensities. This classification results in the addition of modalities and tags to all the identified files.
Medical Imaging Classification
A non-exhaustive list of the imaging modalities that are classified is listed next:
- MR Structural Imaging
T1
T2
PD
T2-star
- MR Perfusion
DCE
DSC
ASL
- Functional MRI
fMRI
- Diffusion MRI
DWI
DTI
HARDI
DSI
- Other MRI
SWI
MRA
CINE
- Other Medical Images
CT
PET
SPECT
US
RadioTherapy (RT)
Representative Tags for Files
In addition to the previous classification, representative tags may also be added by the Medical Image Data analysis depending on the file. A non-exhaustive list of the possible tags added per file type is shown below:
MRI: spgr, mprage, se, flair, gr, post_contrast, magnitude, phase, multi_echo, localizer, …
CT: post_contrast, monitoring, perfusion, angio, venogram, …
PET: fdg, amyloid, pib, tau, …
Image files: png, jpeg, bmp, tiff, gif, …
Tables: csv, tsv, xls, …
Additional file formats: pdf, mat, …
The following Fig. 21 shows a representative classification and tagging of a set of medical imaging data. The color-coded text in capital letters corresponds to the QMENTA Modality (a.k.a modality), while the text in lower case with a blue background corresponds to QMENTA Tags (a.k.a. tags).
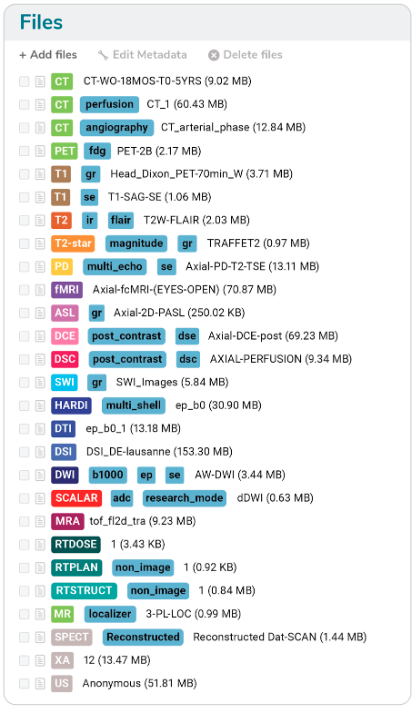
Fig. 21 Representative set of modalities and tags recognized by the QMENTA Platform.
Factors Influencing Upload Time
The overall time needed to upload the data from your local computer to the QMENTA Platform depends on several factors, including but not limited to:
The quantity of files to be uploaded.
The size of the files to be uploaded.
Your internet connection (refer to System requirements)
Uploading Data via the QMENTA Platform Web Browser
Single Timepoint Upload
This section describes the process of uploading the medical imaging data of a single timepoint of a single subject. As previously stated, all files to be uploaded (i.e., DICOM or PDFs, among others) should be compressed into a single ZIP file.
Initiating the Upload process
To begin, you can either:
Go to the Dashboard and click “Upload your Data” (Fig. 22).
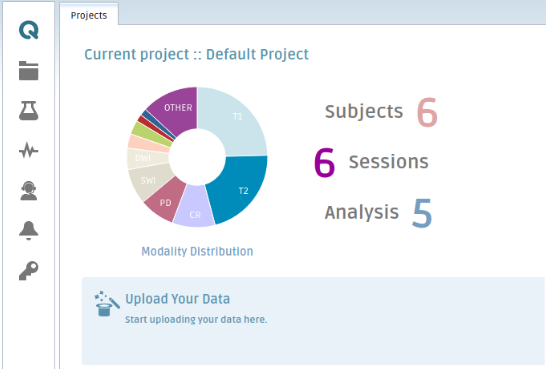
Fig. 22 Upload data from Dashboard.
Or,
From the “Data” tab, click on “Upload Session Data” located in the top left corner (Fig. 23).
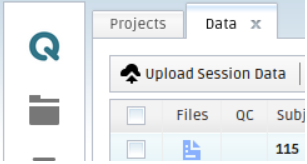
Fig. 23 Upload data from Dashboard from “Data” tab.
With both approaches, the “Upload Data” pop-up window will appear (Fig. 24).
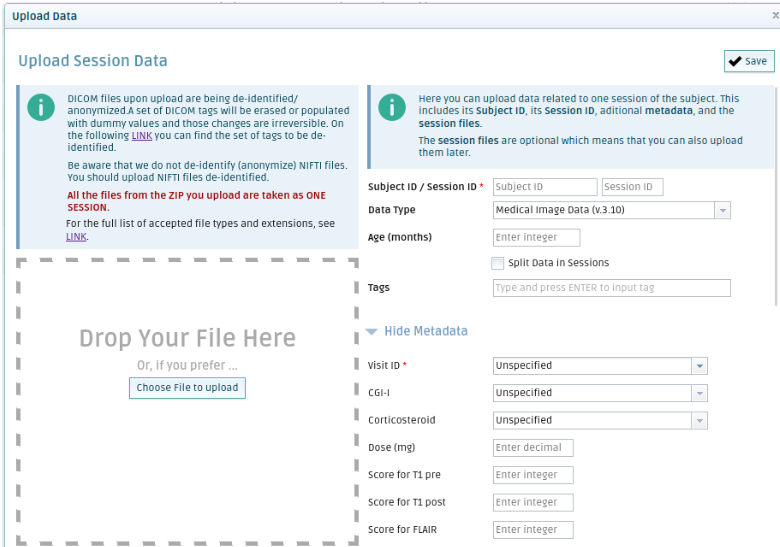
Fig. 24 “Upload Data” pop-up window.
Uploading Your ZIP File
Add your File
Drag and Drop the appropriate ZIP file from your local computer to the bound square that reads “Drop Your ZIP Here”.
Alternatively, click the “Choose ZIP to upload” button and select the corresponding ZIP file from your computer’s pop-up window.
Enter Required Information
After choosing a ZIP file, fill in the “Subject ID” and “Session ID” fields. These fields are mandatory across projects within the QMENTA Platform since they allow the unique identification of the subjects and timepoints within the project.
Subject ID must be a string without special characters.
Session ID must be an integer and it should be sequentially increased from timepoint to timepoint, as shown in the example below.
Baseline - Session ID: 1
Follow-up 1 - Session ID: 2
The version of the Medical Image Data analysis used to process the data may be selected under “Data Type”. Only the default “Medical Image Data (v.3.11)” will appear.
After clicking “Save”, data upload to the QMENTA Platform will begin.
Monitoring the Upload Progress
Once the data transfer begins, a progress bar will appear in the bottom right corner (Fig. 25) to indicate the real-time percentage of the data transferred from your local computer to the QMENTA Platform.
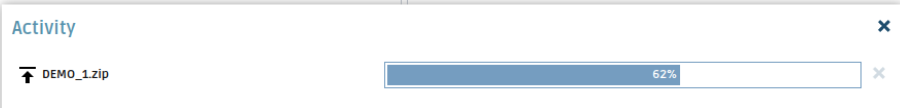
Fig. 25 Upload data progress bar.
Warning
It is important to not close/refresh the QMENTA Platform until the progress bar reads “Data successfully saved!”, nor to erase the selected file from your computer, otherwise the data upload will be interrupted.
Once the initial upload is completed as shown in Fig. 26, the Medical Image Data analysis is automatically started.
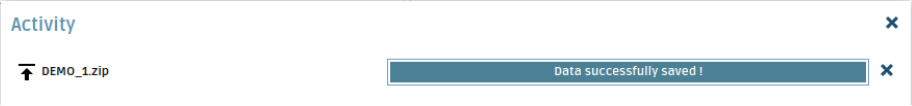
Fig. 26 Upload data completed.
At this stage the status of the new Subject ID/Session ID created will appear as shown in Fig. 27
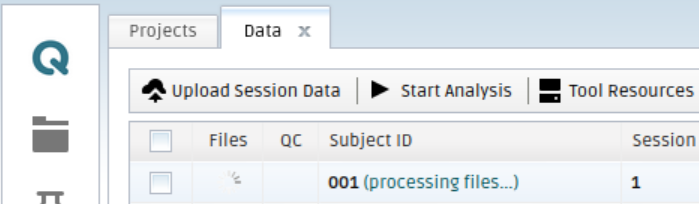
Fig. 27 Status of the new Subject ID/Session.
Once the Medical Image Data analysis has finished, the status of the pair Subject ID/Session ID will appear as shown in Fig. 28
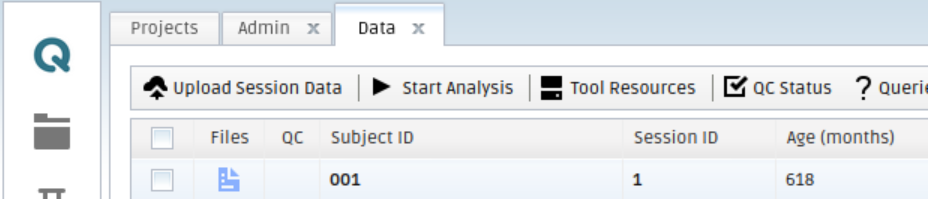
Fig. 28 Status of the new Subject ID/Session once processing has finished.
Single Timepoint Upload with Metadata
It is possible to input metadata associated with the subject at the point of upload. In some projects’ configurations, the inclusion of certain metadata may be mandatory (e.g. if the metadata is a necessary input for a particular analysis). To input metadata during data upload of a single timepoint, you should begin with the same steps as above.
In the “Upload Data” pop-up window (Fig. 29).
The metadata fields to be associated with the Subject ID/Session ID are displayed under the “Show Metadata”/”Hide Metadata” collapsible list.
Mandatory metadata fields must be filled before clicking the “Save” button and starting the data upload process. Otherwise, you will receive the following warning: “Some of the fields are not valid. Please check them and try again!”.
Further information on the supported metadata can be found in the Handling Metadata section.
As shown in the following figure, mandatory metadata fields are indicated with a red “*”. Note that Subject ID/Session ID are also mandatory fields.
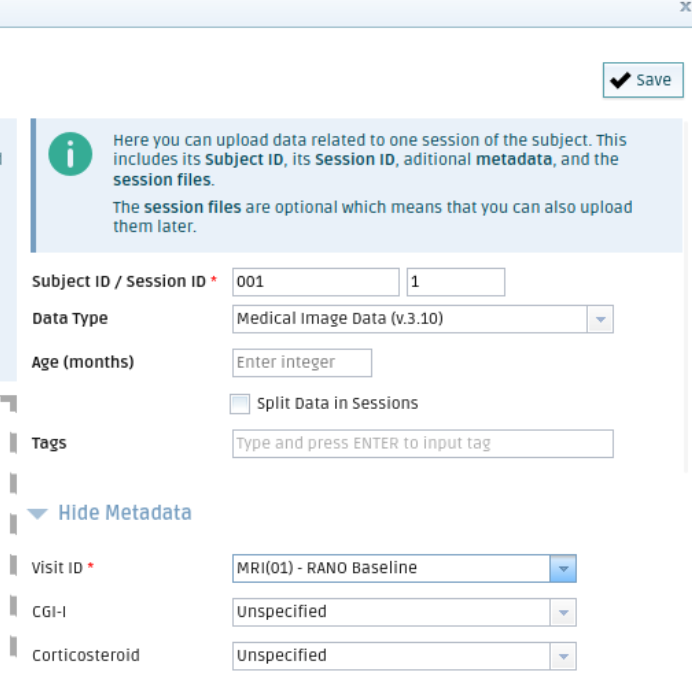
Fig. 29 “Upload Data” pop-up window.
After clicking “Save”, the introduced metadata will appear in the “Data” tab in the same row as the relevant Subject ID/Session ID, as shown below in Fig. 30
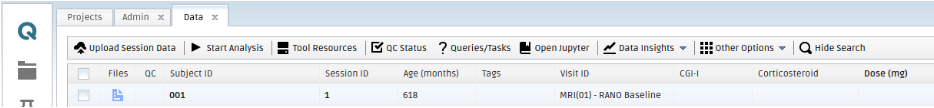
Fig. 30 Visualizing uploaded metadata.
Multiple Timepoints Upload or Bulk Upload
This section describes the process of uploading the medical imaging data of multiple timepoints of a single subject at once. As previously stated, all files to be uploaded should be compressed into a single ZIP file. Note that this approach exclusively applies to the upload of DICOM data to the QMENTA Platform.
To upload multiple timepoints for a single subject, you should begin with the same steps described in section Single Timepoint Upload section. In the “Upload Data” pop-up window (Fig. 31), select the checkbox “Split Data in Sessions”. This indicates to the Medical Image Data analysis that the medical imaging data of multiple timepoints are being uploaded together.
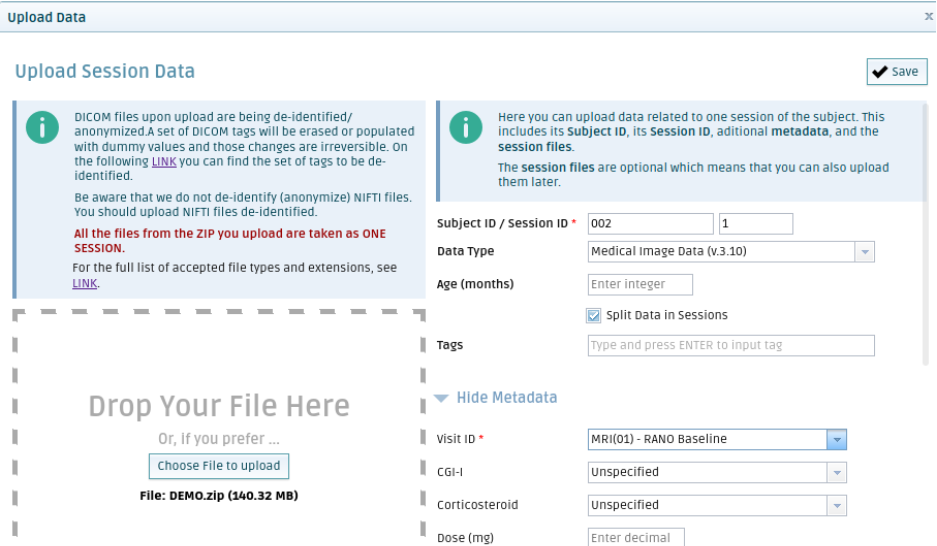
Fig. 31 “Upload Data” pop-up window for multiple timepoints.
Once started, the Medical Image Data analysis will automatically recognize and sort the different timepoints present based on the DICOM tags “Study ID” and “Study Date”. Before the analysis completes, it will create new pairs of Subject ID/Session IDs corresponding to the number of timepoints present. For their unique identification, the Subject ID is maintained across timepoints whilst the Session ID is automatically and sequentially increased.
See an example in Fig. 32 of the final appearance within the “Data tab” of the user input Subject ID/Session IDs once the processing of Medical Image Data analysis is completed as described in section Monitoring the Upload Progress.
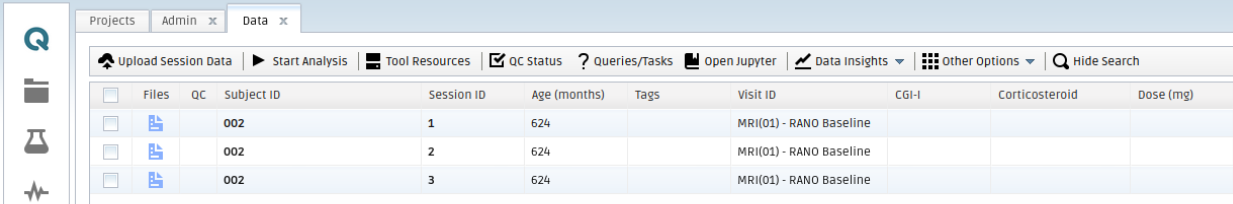
Fig. 32 Visualizing uploaded data.
Multiple Timepoints Upload or Bulk Upload with Metadata
As in the section Single Timepoint Upload, it may be required to input metadata associated with the subject at the point of bulk upload. See the aforementioned section for instructions on inputting metadata during data upload to the QMENTA Platform.
After uploading multiple timepoints, it is important to note that each new Subject ID/Session ID pair (i.e., timepoint) will have exactly the same metadata. This is a result of the impossibility of the QMENTA Platform to know to which timepoint exclusively (if any) the metadata is dedicated to.
Warning
In this scenario concerning bulk upload with metadata, you must review and update as needed the metadata of each of the timepoints.
To update the metadata accordingly, follow the steps indicated in section Project-level Metadata Values Modification, but also shown next for clarity: Right click on the pair Subject ID/Session ID and select “Edit session”.
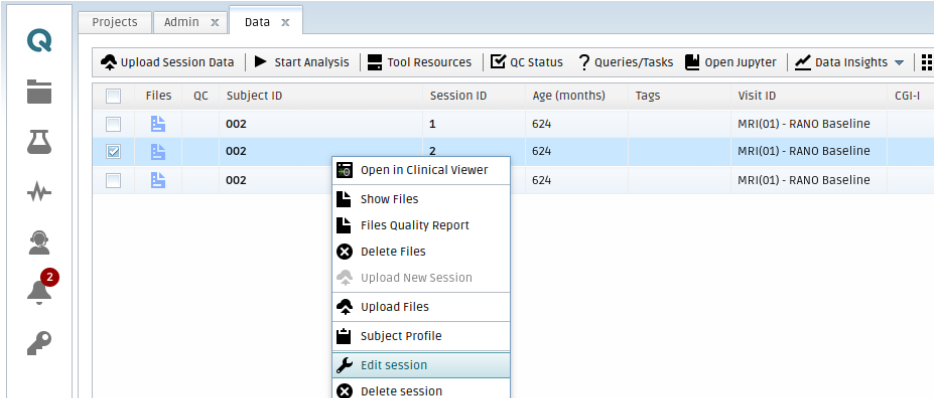
Fig. 33 Access “Edit Session Data” by clicking the mouse left button and clicking on “Edit session”.
Next, edit the metadata as needed in the “Edit Session Data” pop-up window.
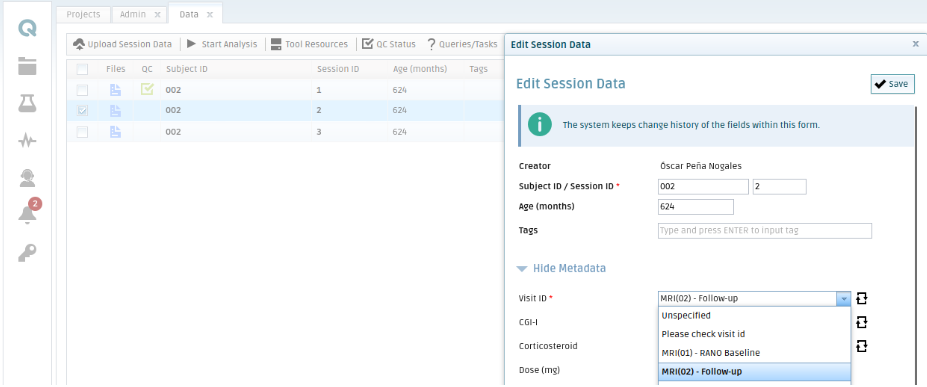
Fig. 34 In the “Edit Session Data” window you can edit the Subject/Session ID along with the Metadata.
and after saving the metadata of the subject will be updated:
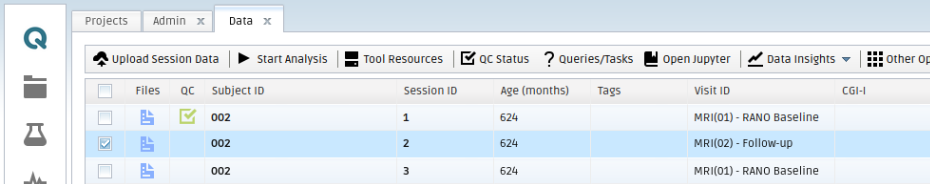
Fig. 35 Once the changes are saved, they will be reflected in the corresponding data row.
PACS Nexus
Medical imaging data, particularly DICOM files, can be uploaded to the QMENTA Platform directly by connecting the PACS of your institution via QMENTA’s PACS Nexus. This enables data transfer from any number of sites to the centralized QMENTA Platform, facilitating data management in large studies.
Due to the scope of this pilot study and for the sake of clarity, this manual does not provide further details on this feature. Please contact support@qmenta.com should you require further information.
Medical Image Data Tool Results
Once the Medical Image Data analysis is complete, you can access the data uploaded through the Data tab by either:
Right-clicking on a Subject ID and selecting “Show Files” (Fig. 36).
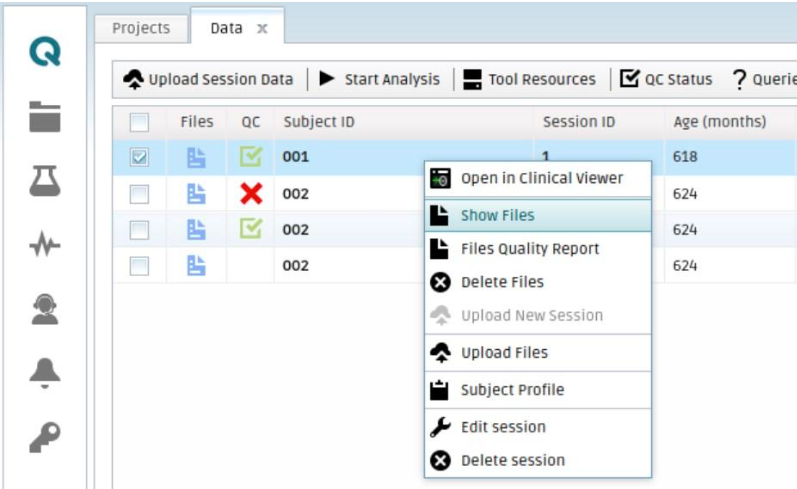
Fig. 36 Pop-up window appearing when right-clicking on a Subject ID.
or
Selecting the row of the Subject ID of interest and clicking “Other Options”, then “Subject Profile”. This will open a new tab showing some information from each of the Session IDs of the subject. From there, select a particular Session ID and click “See uploaded files” (Fig. 37).
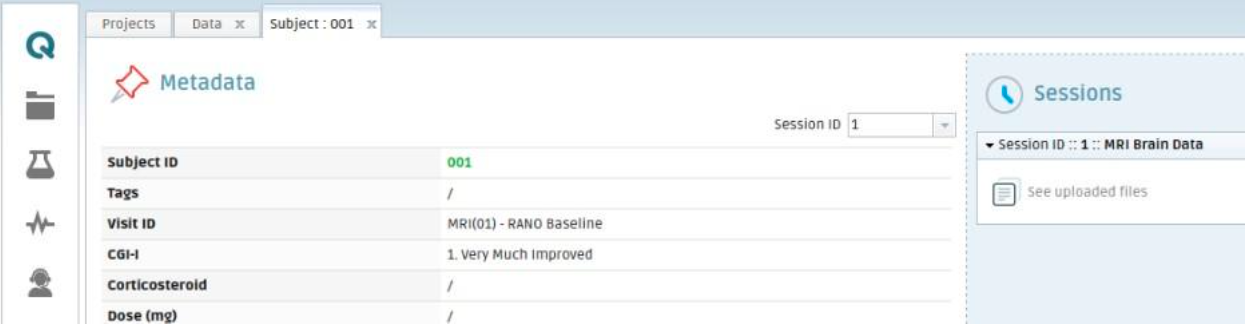
Fig. 37 Subject profile tab. It shows the metadata of the selected Session ID via the drop-down (see Handling Metadata) and on the right-hand side allows visualization of the files of the corresponding session.
In either case, the pop-up window shown in Fig. 38 will open showing the uploaded files together with the modalities and tags automatically added by the Medical Image Data analysis, as described in sections Medical Imaging Classification and Representative Tags for Files.
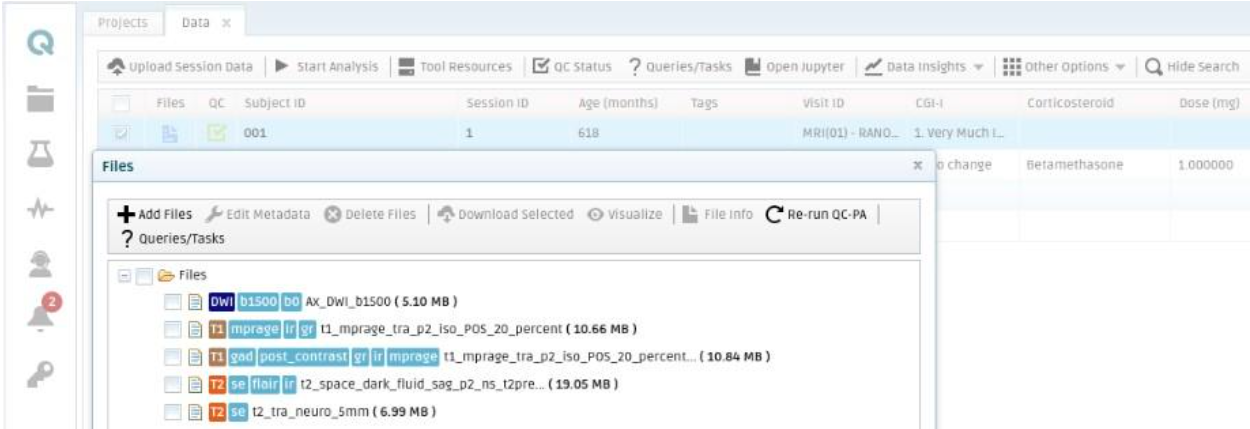
Fig. 38 Files pop-up window with an example set of files uploaded for a selected pair of Subject ID/Session ID. The automatically identified modalities are shown in a color-code representation and in capital letters (i.e., DWI, T1, T2). The tags are in lower cases and light blue.
These modalities and tags allow for the easy identification of the data available throughout the QMENTA Platform. In particular:
The modality may be added as a search criterion when performing project data searches as indicated in section Filtering Metadata.
Both modalities and tags are used as filters to automatically select the appropriate files for an analysis as shown in section Starting an Analysis.
After selecting any of the files listed in the “Files” pop-up window (Fig. 38), you can choose to:
“Edit Metadata”: This action will open a pop-up window (Fig. 39) that gives you the possibility of modifying the modality and tags automatically identified by the Medical Image Data analysis for the selected file. The modality must be chosen from those available in the dropdown list, but you can add any desired tag. Ensure to click “Save” after making changes. This step might be required in the event that you consider the automatic classification to be incorrect.
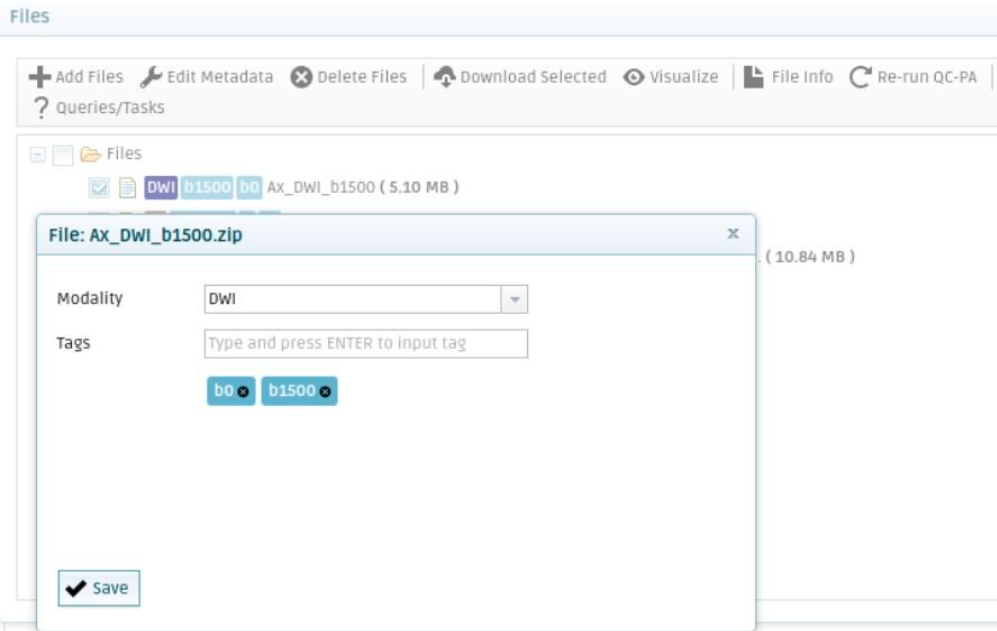
Fig. 39 Edit metadata pop-up window. Allows you to edit the modality and tags. You must click on “Save” after making any changes.
“Delete Files”: This action will delete the selected file(s) from the QMENTA Platform.
“Download Selected”: This action will download the selected file(s) from the QMENTA Platform to your local computer.
“Visualize”: Only applicable to DICOM series and NIfTI images. This action will open a pop-up window (Fig. 40) that allows you to visualize the selected file.
In this viewer you can visualize the images in any of its planes (axial, sagittal, and coronal) and cycle the main slice view in a clockwise rotation via the “Swap View” button. The “+” and “-” buttons on the top right corner and the mouse’s wheel allow you to move across slices on the main slice view. You can also move across slices of specific planes with the keyboard:
“Arrow up/down” to move across coronal slices.
“Arrow right/left” to move across sagittal slices.
“Page up/down” to move across axial slices.
The buttons “Go To Center” and “Go to Origin” take you to the center of the image and the origin of coordinates, respectively. The gradient on the top right corner allows you to change the rotation of the image, the colormap, and the window level. The window level can also be changed by right clicking and dragging the mouse. On the other hand, the left click allows you to identify the coordinates and intensity of the different voxels of the image (these values will be shown at the bottom). Pressing “Alt”, left click, and dragging allows you to zoom in and out of the image. Further, pressing “Alt”, “Shift”, left click, and dragging allows you to pan a zoomed image. Next to the gradient on the top right corner there can either be a globe or a plane with crosshairs. These allow you to change the coordinate and view of the image from the image units (i.e., millimeters) to the image coordinates. Also, in 4D series you can move back and forth across series via the “,” and “.” buttons of the keyboard. Last, on the top left corner there are available the “View”, “Settings”, and “Help” buttons. These will allow you to further understand previous actions and modify certain viewer settings such as the smooth display of the image, the inclusion of a ruler, and cross-hairs among other view configuration options.
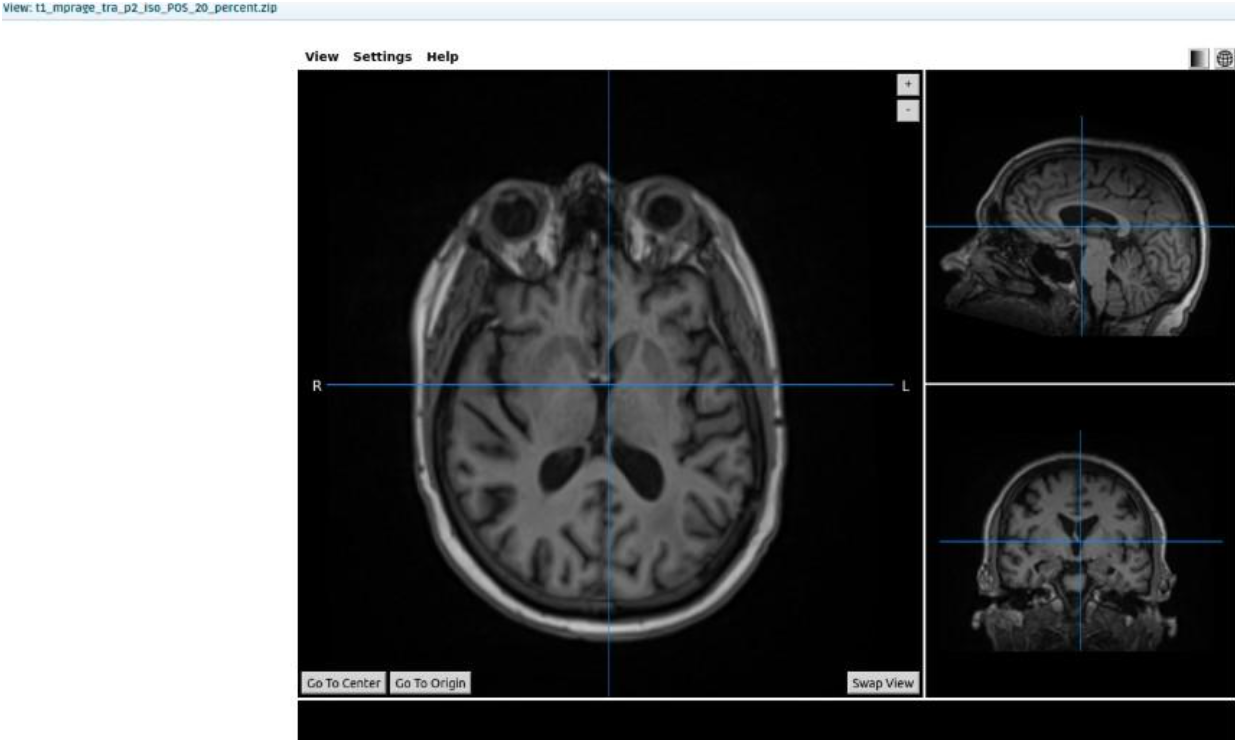
Fig. 40 QMENTA Platform viewer.
“File info”: In addition to adding modalities and tags to files, the Medical Image Data analysis also extracts file-level metadata from the file’s DICOM headers. This action will open a pop-up window (Fig. 41) and offers the possibility of visualizing all the metadata extracted for each file (a.k.a File Info). Further details on this are available in section Metadata Visualization.
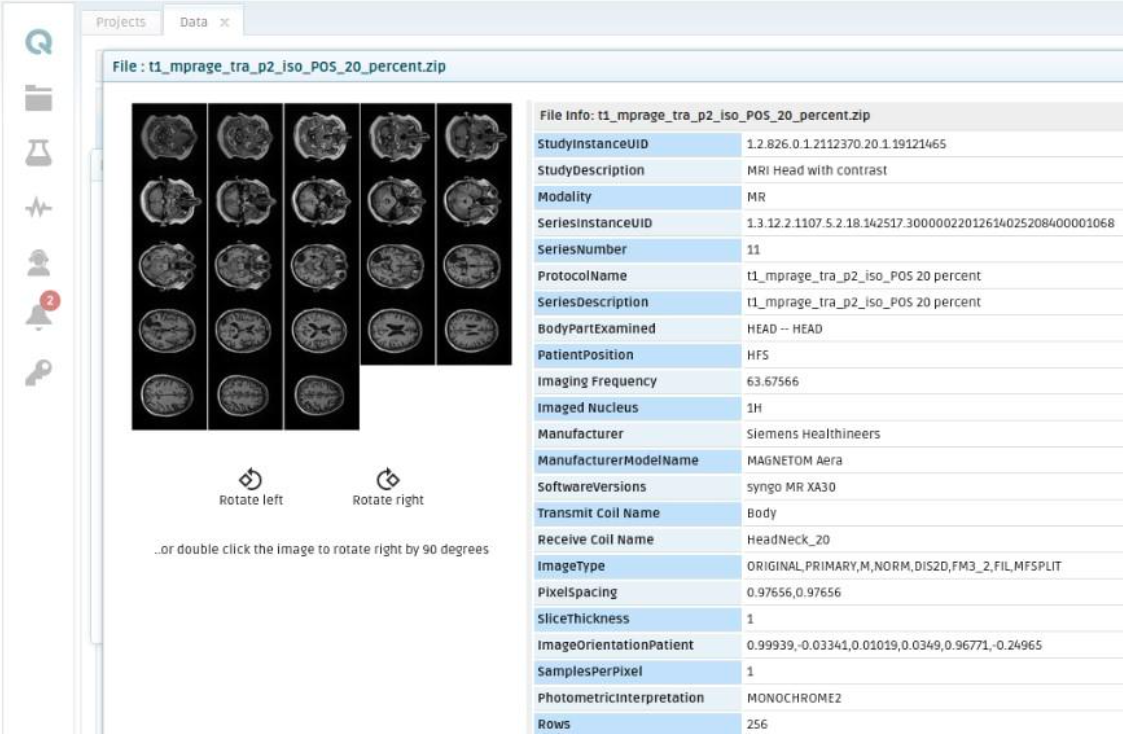
Fig. 41 File information pop-up window showing all the automatically extracted DICOM metadata by the Medical Image Data analysis.
In addition to performing the previous actions, you can also upload new files to the corresponding data session from the pop-up window shown in Fig. 38. Click on “Add Files” and the pop-up window shown in Fig. 42 will appear.
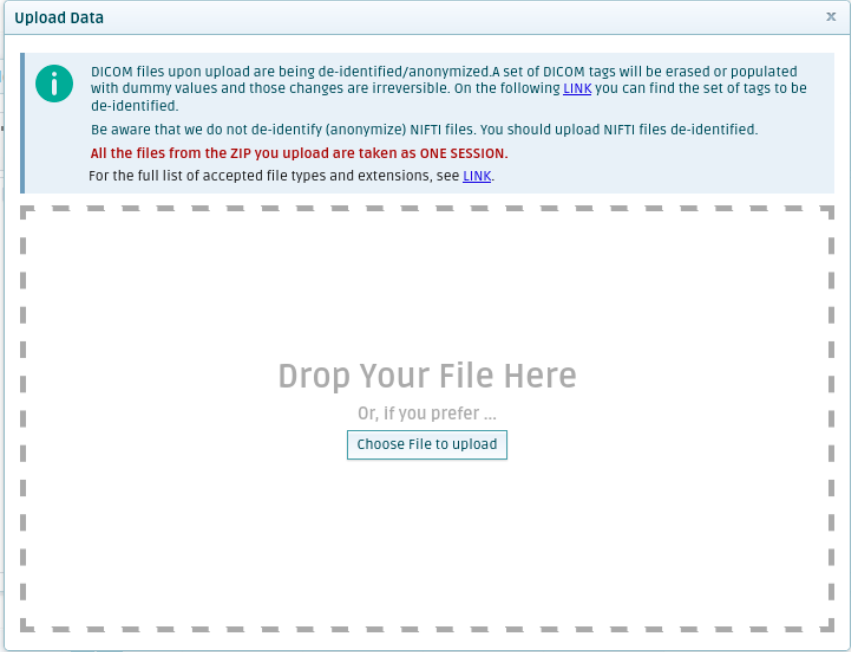
Fig. 42 Pop-up window that can be used to upload new data files to an existing session in a project of the QMENTA Platform.
In this pop-up window you can drag and drop a zip file to be uploaded to the session. Upon dropping the file, the pop-up window will close automatically. This will trigger the Medical Image Data analysis as previously described in this section. Upon execution of the analysis, the new uploaded files will be available in the corresponding Subject ID/Session ID.
QC Status
In the QMENTA Platform the quality of the uploaded data can be checked in several ways, both automatically and manually. The result of any inspections can be stored in a visual way within the QC Status (Fig. 43). In the Data tab, every Subject ID/Session ID pair has a “QC Status”, as can be seen in the following figure:
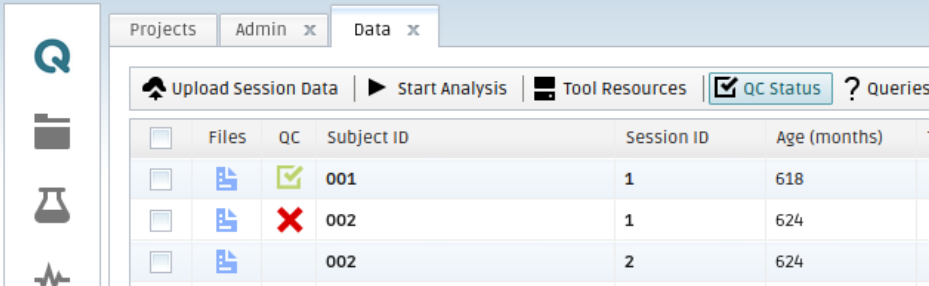
Fig. 43 QC Status. It is assigned to each pair Subject ID/Session ID.
The QC Status can have one of the following values:
Undefined: Default value.
PASS: Passed quality check.
FAIL: Failed quality check.
The QC Status can be automatically or manually modified. It can be used to help visualize QC statistics of a project or to identify subjects as indicated in section Project Data Insights.
Automatic QC Status Modifications
The Protocol Adherence Automation Analysis is an in-house analysis implemented in the QMENTA Platform that allows the comparison of the uploaded data of a Subject ID/Session ID to a set of predefined rules. Each of these predefined rules comprise requirements that are applied to imaging metadata parameters such as TE, TR, b-values and Voxel Size, among others. If the rules are written to align with the imaging charter of the study, the Protocol Adherence Automation Analysis will facilitate quick identification of protocol deviations.
The Protocol Adherence Automation analysis makes a cross-comparison of all the uploaded series to all the set of predefined rules. During this iterative process, if it can find any series that adheres to a rule, that rule will be considered to have passed. If no file adheres to a rule, the rule will be considered to have failed. As a result, the overall QC Status of the subject session will be set to PASS when the whole set of predefined rules are passed. Otherwise, it will be set to FAIL. In both cases, the decision on the QC Status (PASS/FAIL) is accompanied with a text with a detailed explanation of why the corresponding QC Status was chosen.
Example PASS QC Status and message:
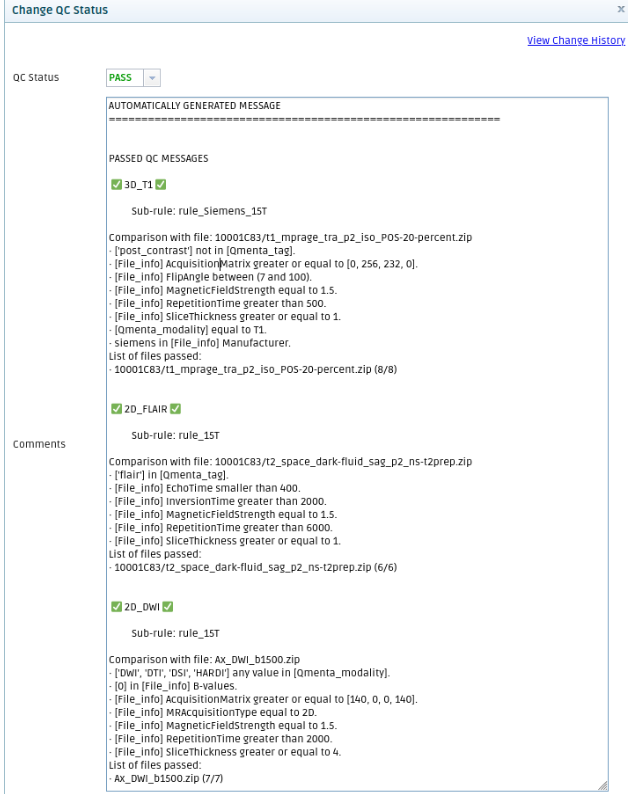
Fig. 44 PASS QC example. For each rule that passes, the name(s) of the adhering series is shown next to it.
Example FAIL QC Status and message:
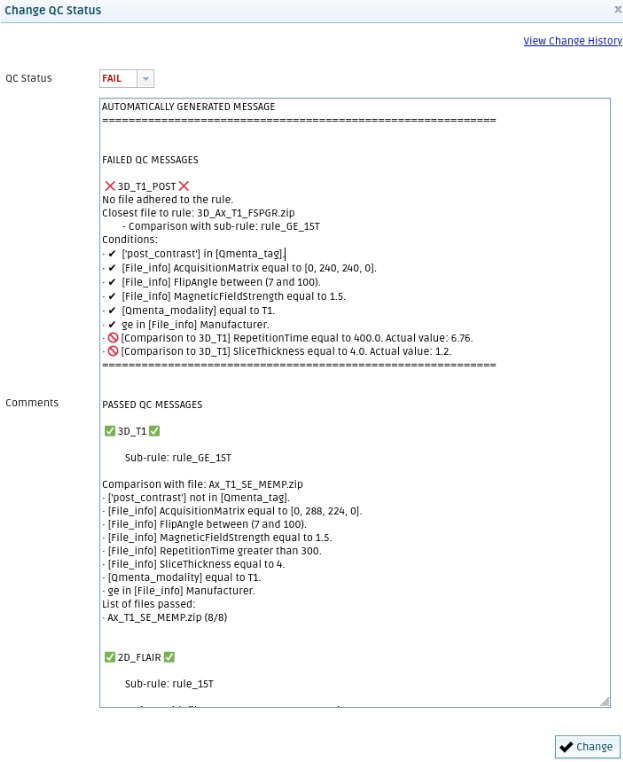
Fig. 45 FAIL QC example. If no series adheres to a certain rule, the name of the most closely matching series is shown alongside a list of conditions that facilitate understanding of why the series does not pass the rule. A “black tick” indicates the satisfied requirements while a “crossed red circle” indicates those not satisfied.
Note
A project’s predefined rules are implemented by QMENTA personnel. Please contact support@qmenta.com for support on configuring and applying imaging protocol requirements as rules in your project via the Protocol Adherence Automation analysis. Note that for each QMENTA project, the predefined rules must be individually configured.
The Protocol Adherence Automation analysis can be started in two different ways:
Automatically: Upon data upload the Protocol Adherence Automation analysis can be configured to start automatically for the uploaded Subject ID/Session ID. See further details in section Automatic Analysis Triggers.
Manually: After selecting a Subject ID/Session ID you can manually start the Protocol Adherence Automation analysis by clicking “Start Analysis”, selecting “Protocol Adherence” in the dropdown menu of the pop-up window and finally clicking the “Start Analysis” button. See further details on the analyses the QMENTA Platform supports in section Analysis Management.
Warning
When performing Bulk Uploads (Multiple Timepoints Upload or Bulk Upload) to the QMENTA Platform, the Protocol Adherence Automation analysis will only be automatically executed on the pair Subject ID/Session ID manually input by you.
Manual QC Status Modifications
Independently of the QC Status automatically configured by the Protocol Adherence Automation analysis, the QC Status and the accompanying text can be manually modified. The modification can be done by selecting a pair Subject ID/Session ID and then clicking “QC Status”. This will open the “Change QC Status” window (Fig. 46). In this window both the “QC Status” and the QC “Comments” can be modified. After the needed modifications are made, click “Change”.
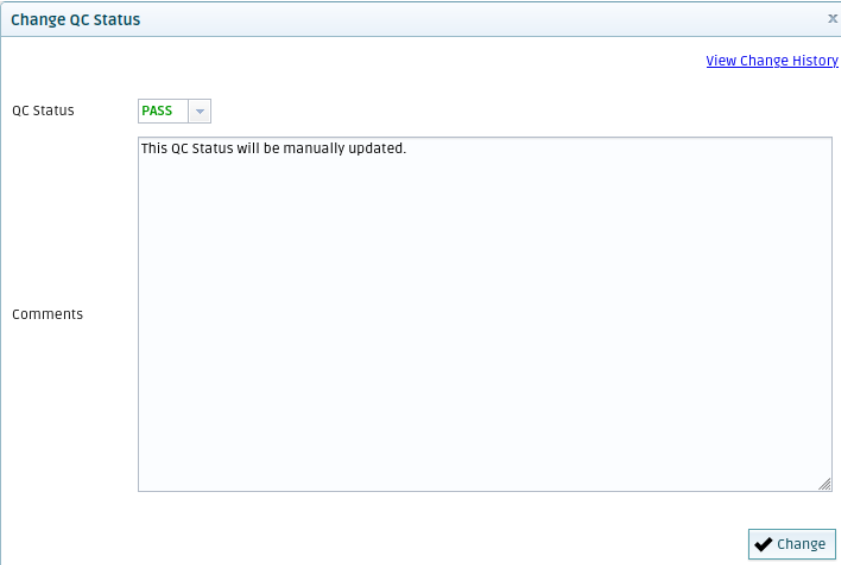
Fig. 46 Change QC Status window. After making any change you must click “Change”.
The following confirmation window (Fig. 47) will pop-up. Click “OK” to confirm the change.
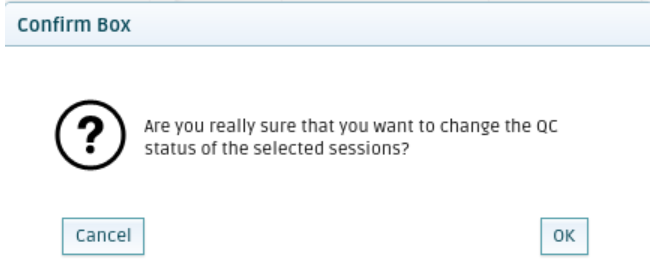
Fig. 47 Confirming QC Status change.
The history of changes can be visualized by clicking “View Change History” on the same “Change QC Status” window (Fig. 48).
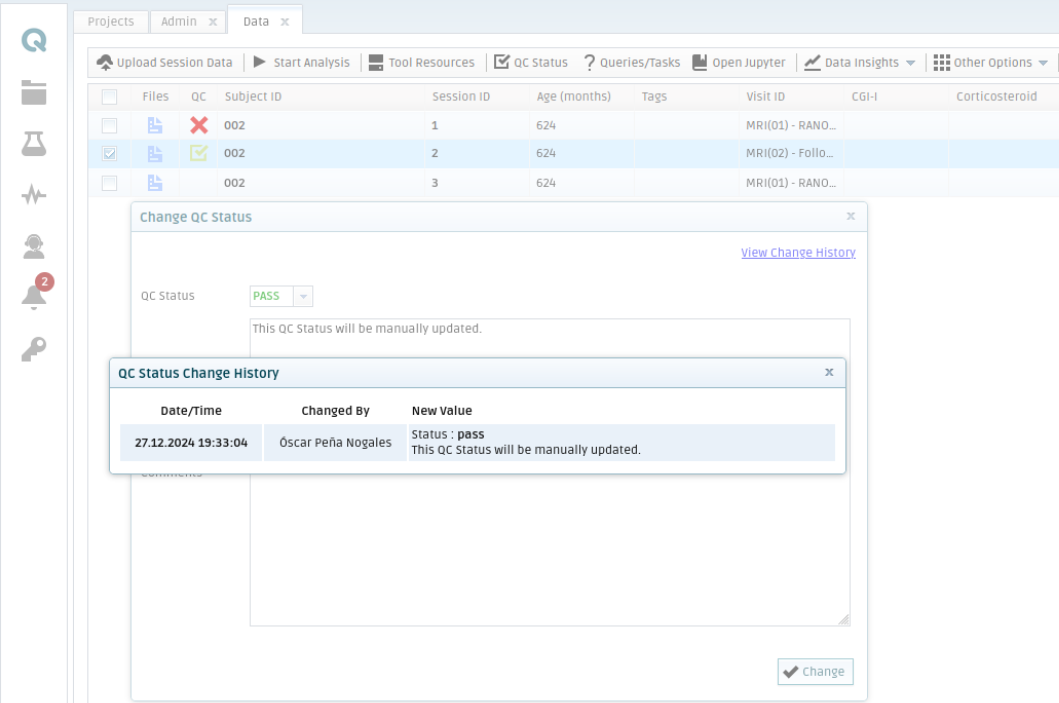
Fig. 48 View QC Status changes history.
The purpose of enabling manual modifications of the QC Status is to override the automatic decision taken by the Protocol Adherence Automation analysis, taking into consideration both the parameters of the uploaded data and the visualization of the actual data itself.
Handling Metadata
The QMENTA Platform can handle different types of metadata as mentioned in sections Data Upload and QC Status. In this section you will be guided through all the metadata functionalities available in the QMENTA Platform.
Metadata Visualization
Project-level Metadata Fields
In the Data tab you can visualize all the information about the data available in the active project (Fig. 49).
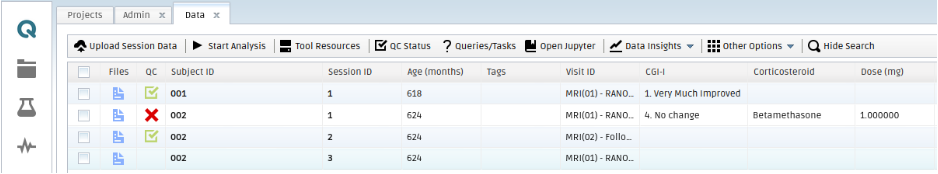
Fig. 49 Project-level Metadata visualization.
The default metadata fields available in all projects are: - QC - Subject ID - Session ID - Age (months/years) - Tags
These default fields are permanent and so are not modifiable via the Metadata Manager explained in section Project-level Metadata Fields Creation and Modification. Their values, however, may be edited, and this is described in section Project-level Metadata Values Modification.
Additional metadata may be added to a project where both the field and its values may be modified. In this example, the header row of the table shows specific metadata fields that are configured as visible to the users of the active project. In this particular case, these correspond to:
Visit ID
CGI-I
Corticosteroid
Dose (mg)
File-level Metadata (File Info)
In addition to the metadata fields visible at the project level, metadata is also extracted directly from each uploaded file by the Medical Image Data analysis (see Medical Imaging Classification). This includes each file’s modalities and tags, as well as specific file-level metadata extracted from its DICOM headers (see sections Representative Tags for Files for Files and Medical Image Data Tool Results). Visualize this additional file-level metadata by right clicking on a pair Subject ID/Session ID in the Data tab and selecting “Show Files”. This will open the “Files” tab displaying a list of all the data of the selected pair Subject ID/Session ID. By selecting one file and clicking “File Info” a new tab will open (Fig. 50) with all the metadata extracted by the Medical Image Data analysis from the DICOM headers.
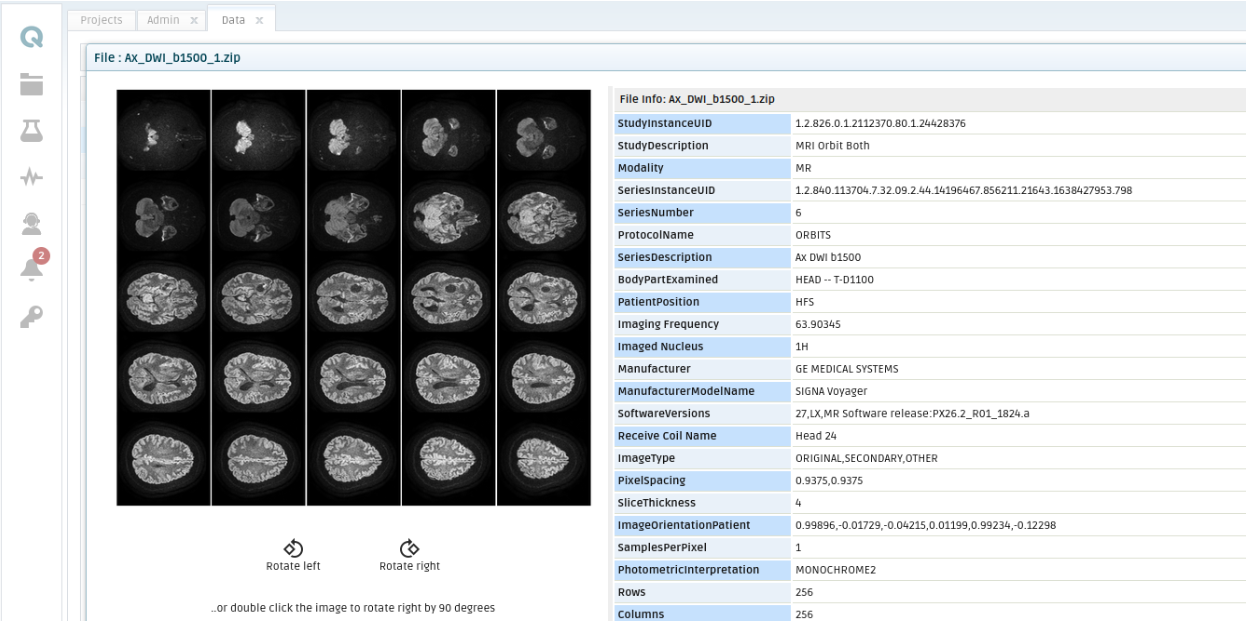
Fig. 50 File information from a file. See a file image preview on the left-hand side and file-level metadata on the right-hand side. The extracted set of DICOM tags depend on the available tags in the file.
Project-level Metadata Values Modification
Note
This subsection applies only to project-level metadata fields and their contents. It is not possible to modify the fields or values of file-level metadata (File Info), with the exception of modalities and tags. Refer to section Medical Image Data Tool Results for instructions on how to modify file modalities and tags.
In order to manually edit the content of any of the project level metadata fields available in the QMENTA Project you can do as follows:
From the Data tab, select a row with a Subject ID/Session ID and go to “Other Options -> Edit Session”.
Right click a Subject ID and select “Edit Session”.
In both cases the “Edit Session Data” pop-up window will appear as shown in Fig. 51.
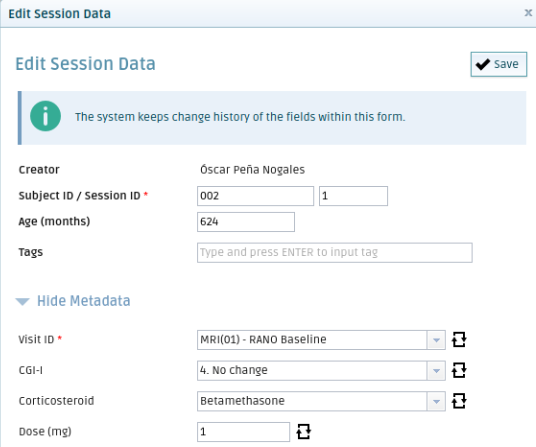
Fig. 51 Edit Session Data window. In this window you can modify the Subject ID/Session ID as well as metadata of the pair Subject ID/Session ID.
In this window you can visualize the name of the user that uploaded the Subject ID/Session ID (“Creator”). Next, you can also visualize and modify all the metadata present in the corresponding QMENTA Project.
In the upper-half of the window you can modify the Subject ID, Session ID, Age, and include any number of tags to facilitate the quick identification of subjects.
In the bottom-half of the window, opening the “Show Metadata / Hide Metadata” collapsible list you can modify all the metadata fields enabled in the QMENTA Project. Further, by clicking the looping arrows you can visualize the history of changes of any metadata field as shown in Fig. 52.
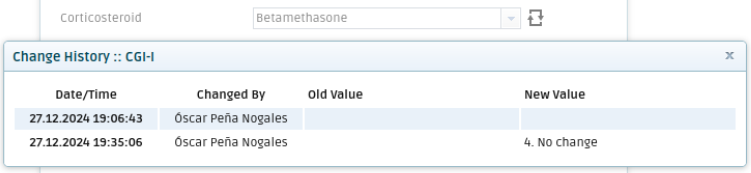
Fig. 52 Metadata changes history.
Note
The content of any of the metadata fields available in the QMENTA Project may also be modified automatically by certain analyses executed.
Project-level Metadata Fields Creation and Modification
If you need to create or modify Project-level metadata fields, please follow these instructions. From the Data tab, click on “Other Options -> Metadata Manager”. The “Metadata Manager” pop-up window will appear as shown in Fig. 53.
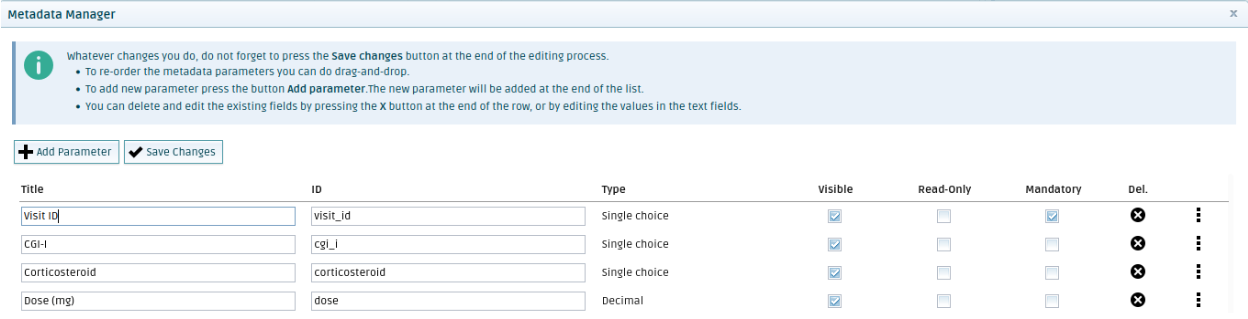
Fig. 53 Metadata Manager. It can be used to modify the project-level metadata of the active project.
As can be seen on the image above, you can add new metadata parameters by clicking the “+ Add Parameter” and filling the new row that will appear at the bottom of the list. The different elements of that row correspond to:
“Title”: Name of the project-level metadata field. This is the name that the user will see in the main “Data” tab.
“ID”: ID of the metadata.
“Type”: Dropdown to select the metadata type. It can be one of the following:
String
Integer
List
Date
Decimal
Single choice
Multi choice
Date-time
“Visible”: Checkbox to select whether the metadata field is visible or not on the main “Data” tab or during data upload as shown in section Single Timepoint Upload with Metadata.
“Read-Only”: Checkbox to block users from editing the metadata field via the previously explained “Edit Session Data” pop-up window. These metadata fields are still editable via the analyses.
“Mandatory”: Checkbox to select whether the metadata field is mandatory or not upon data upload as described in section Single Timepoint Upload with Metadata.
“Del.”: Button to delete the metadata field.
“More Options”: Only applicable if “Type” is “Single choice” or “Multi choice”. It is used to define the options of those types of metadata fields.
After making any modifications, click “Save Changes”.
Filtering Metadata
On the right hand side of the main Data tab of the active project there is a section titled “Search Criteria”. You can use this functionality to perform both project-level and file-level metadata searches in the active project.
You can use a variety of filters, including combinations of filters, to perform a search. Once the desired search criteria have been added, click the “Search” button.
See next a few examples:
Searches based on the “Subject ID”.
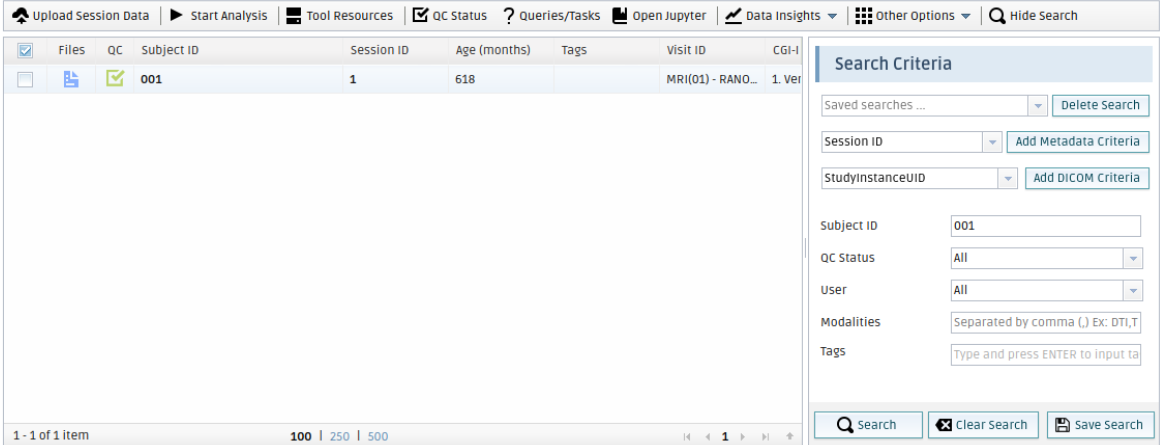
Fig. 54 Searches based on the “Subject ID”. Note the filling of the Subject ID field with “001” in the Search Criteria section.
Searches based on the “QC Status”.
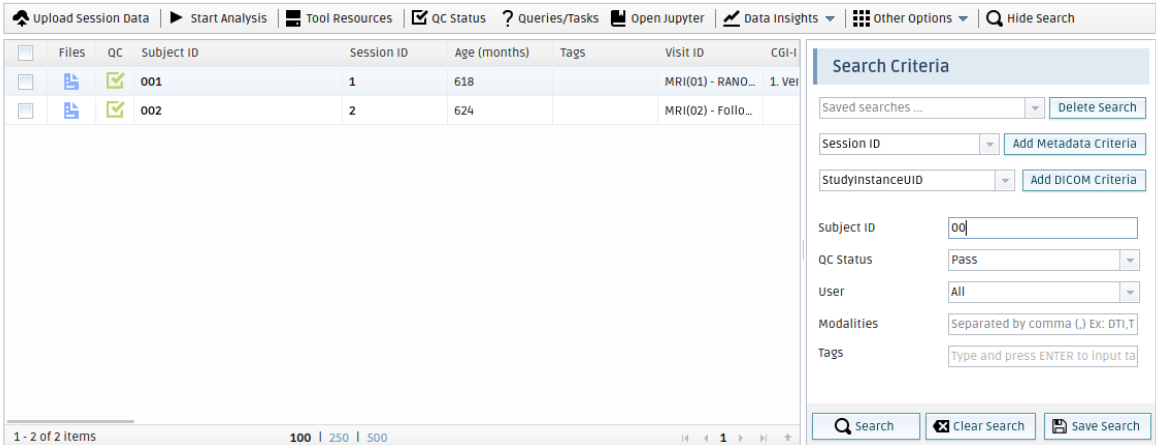
Fig. 55 Searches based on the “QC Status”. Note the filling of the QC Status field with “Pass” in the Search Criteria section.
Searches based on the “User” that uploaded the corresponding Subject ID.
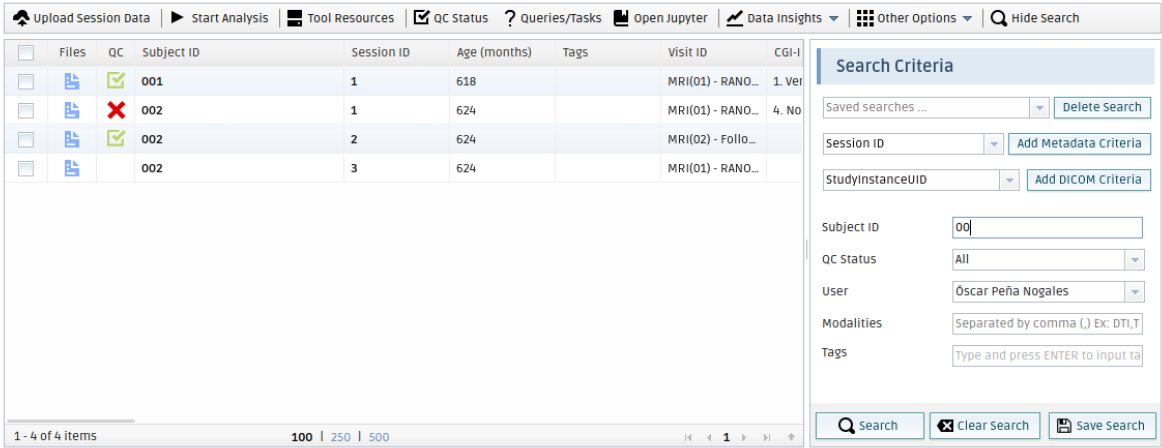
Fig. 56 Searches based on the “User” that uploaded the corresponding Subject ID. Note the filling of the User field with the user’s name in the Search Criteria section.
Searches based on the QMENTA Modalities identified by the Medical Image Data analysis upon data upload.
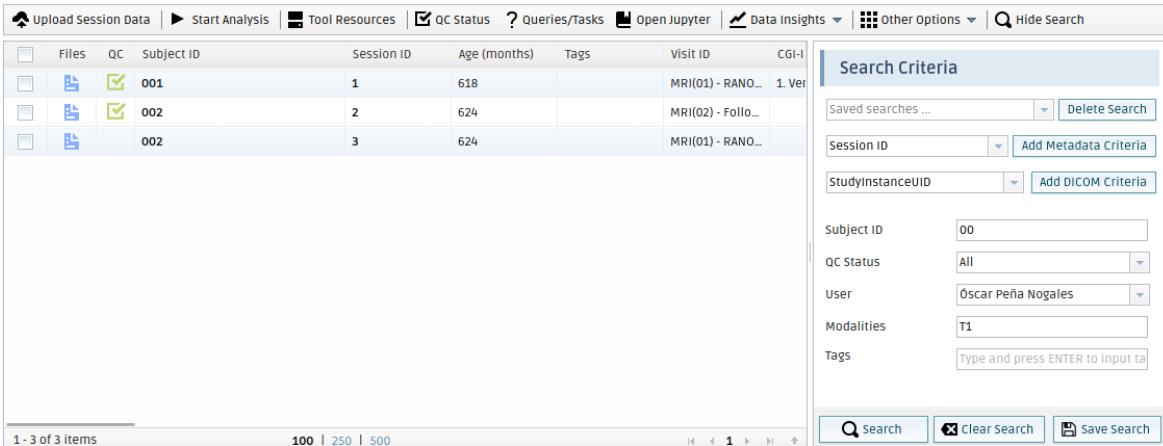
Fig. 57 Searches based on the medical imaging modality. Note the filling of the Modalities field with “T1” in the Search Criteria section.
Searches based on the “Tags” added to the subjects via the “Edit Session Data” pop-up window as shown before.
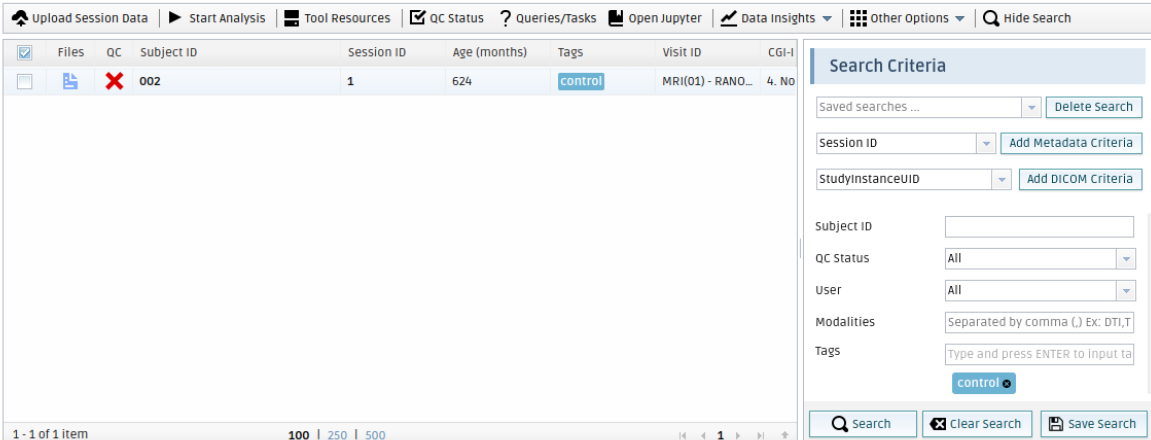
Fig. 58 Searches based on “Tags” added to the subjects. Note the filling of the Tags field with “control” in the Search Criteria section.
Searches based on the project-level metadata fields available in the active project. From the dropdown list of metadata fields you need to select one metadata and click “Add Metadata Criteria”. This will add the new search criteria below.
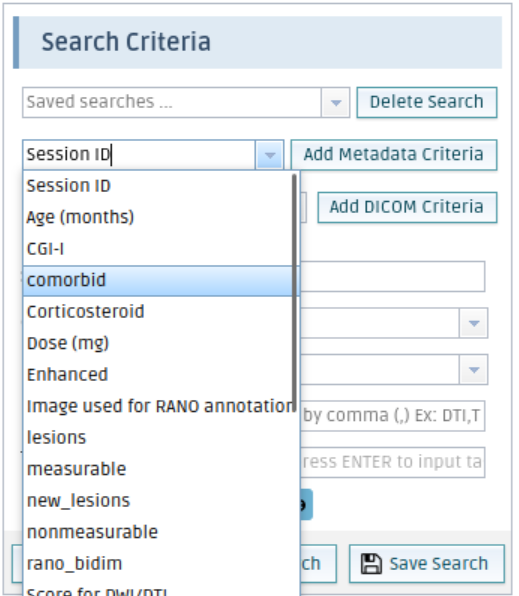
Fig. 59 Select project-level metadata criteria.
Next, the desired search conditions can be included.
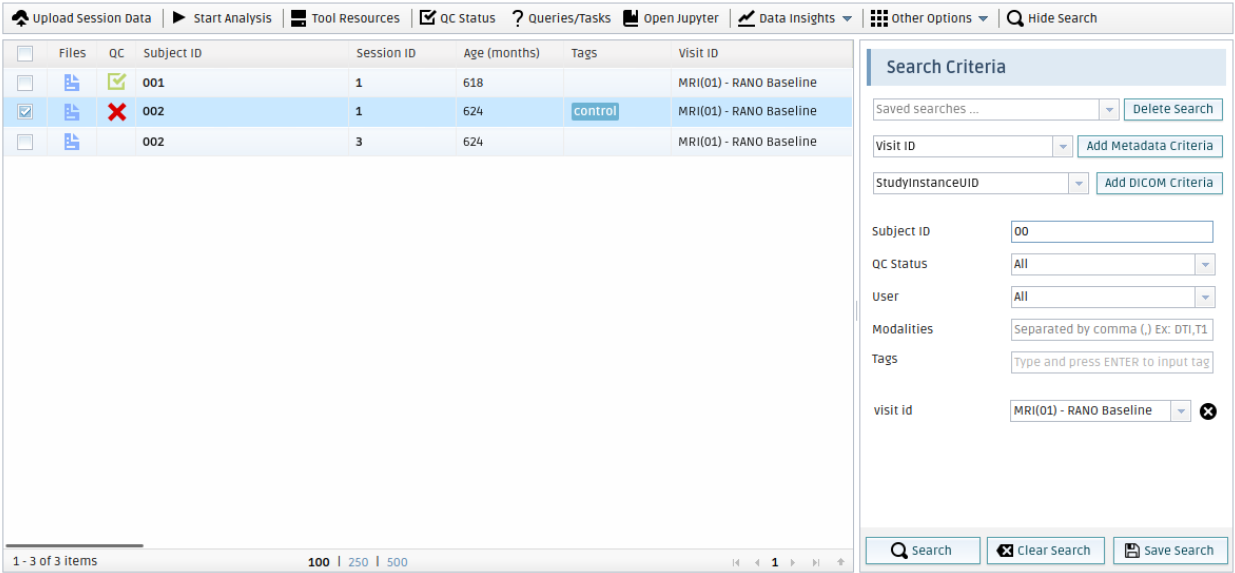
Fig. 60 Searches based on the project-level metadata fields defined in the project. Note the addition and filling of the Visit ID field in the Search Criteria section.
Searches based on the file-level (DICOM) metadata extracted by the Medical Image Data analysis upon data upload. From the dropdown list of DICOM metadata extracted you need to select one field and click “Add DICOM Criteria”. This will add the new search criteria below.
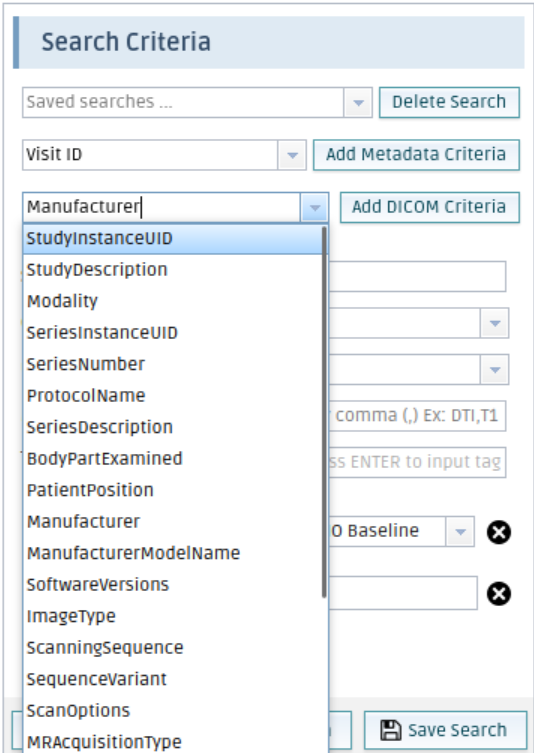
Fig. 61 Select DICOM criteria from the file-level metadata.
Next, the desired search conditions can be included.
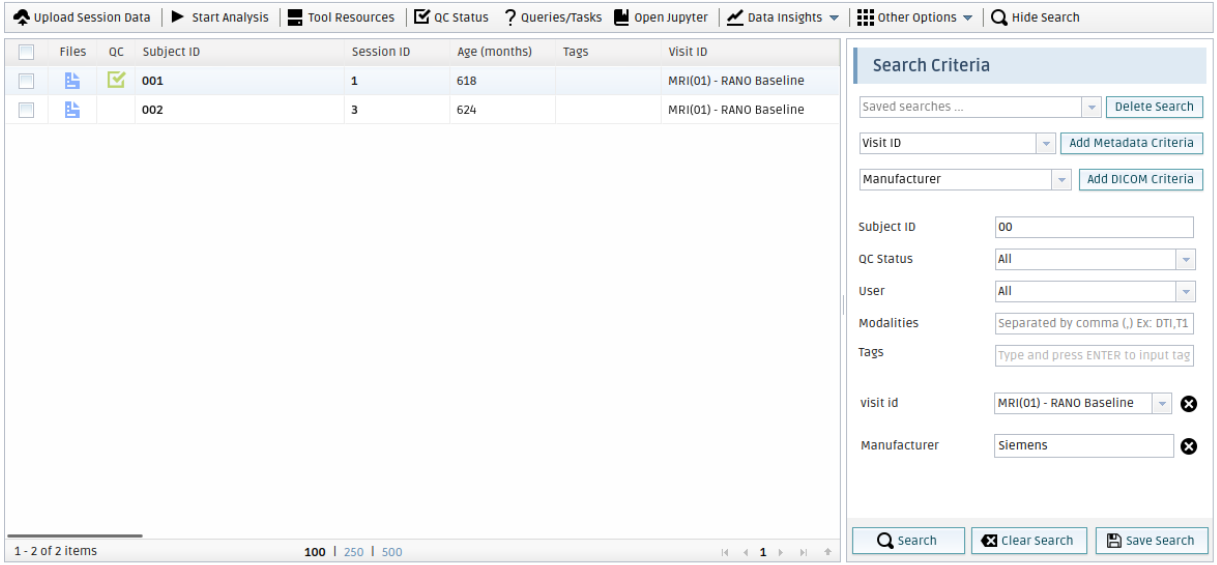
Fig. 62 Searches based on the file-level DICOM metadata. Note the addition and filling of the Manufacturer field in the Search Criteria section.
Project-level Metadata Export
All the project-level metadata can be directly exported into a spreadsheet. From the main Data tab, click “Other Options -> Export Metadata” and the “Export Metadata” pop-up will appear as shown in Fig. 63. Select the needed metadata configuration to export together with the needed metadata fields, select “Prepare CSV File” and a CSV will be downloaded.
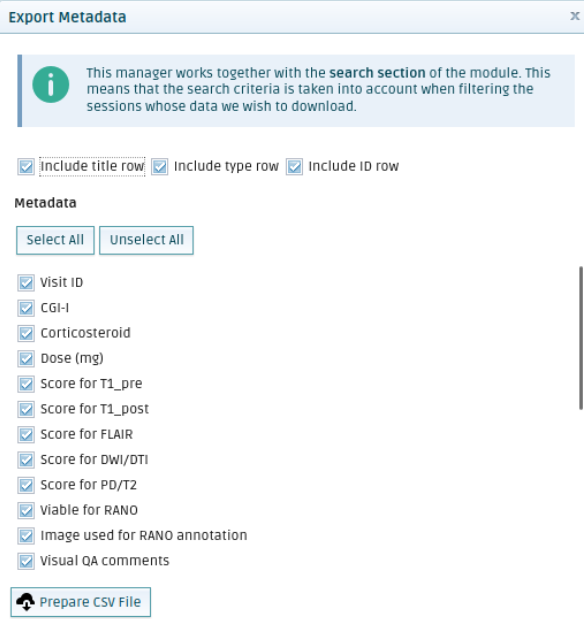
Fig. 63 Export Metadata window to export all the project-level metadata into a CSV file.
Note
The metadata exported will only comprise that of the Subject/Session IDs obtained after filtering via the “Search Criteria” functionality. If no search query has been performed, the export will consider all Subject/Session IDs available.
Project-level Metadata Import
Similarly to the project-level metadata exports described in the previous section Project-level Metadata Export, it is also possible to import project-level metadata to all the data sessions simultaneously by uploading a CSV file.
This can be done from the main Data tab via the “Import Metadata” pop-up window (Fig. 64) that will open after clicking “Other Options -> Import Metadata”.
Nevertheless, we recommend that only advanced users of the QMENTA Platform use this approach, given that the CSV must have a specific structure. To learn more about metadata import please refer to this article.
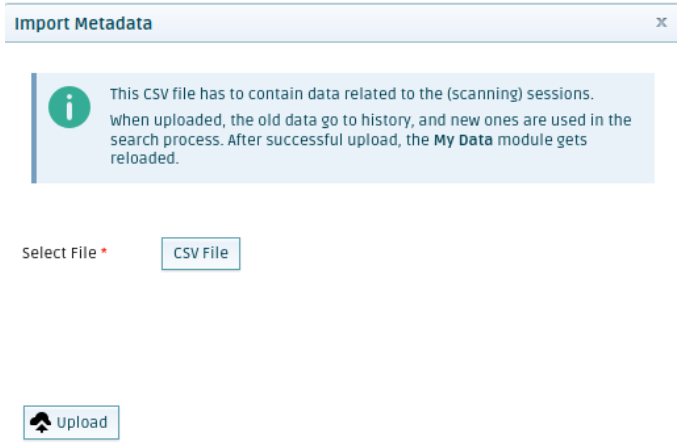
Fig. 64 Metadata Import.
Metadata Statistics
Medical imaging studies include clinical scores, demographic information, behavioral data, and a broad variety of metadata. It is crucial for researchers to analyze the characteristics of these variables and understand their relationships with imaging biomarkers.
The Metadata Statistics feature allows you to quickly gain a high-level appreciation of the characteristics of the project-level metadata by plotting their values. The type of plot is automatically determined, such as a circle plot, histogram, or scatter plot. The plot can also be downloaded as picture (.png) or file (.csv).
In order to open the “Metadata Statistics” tab, open the “Data” tab (1), click “Data Insights” (2) and then click “Metadata Statistics” (3).
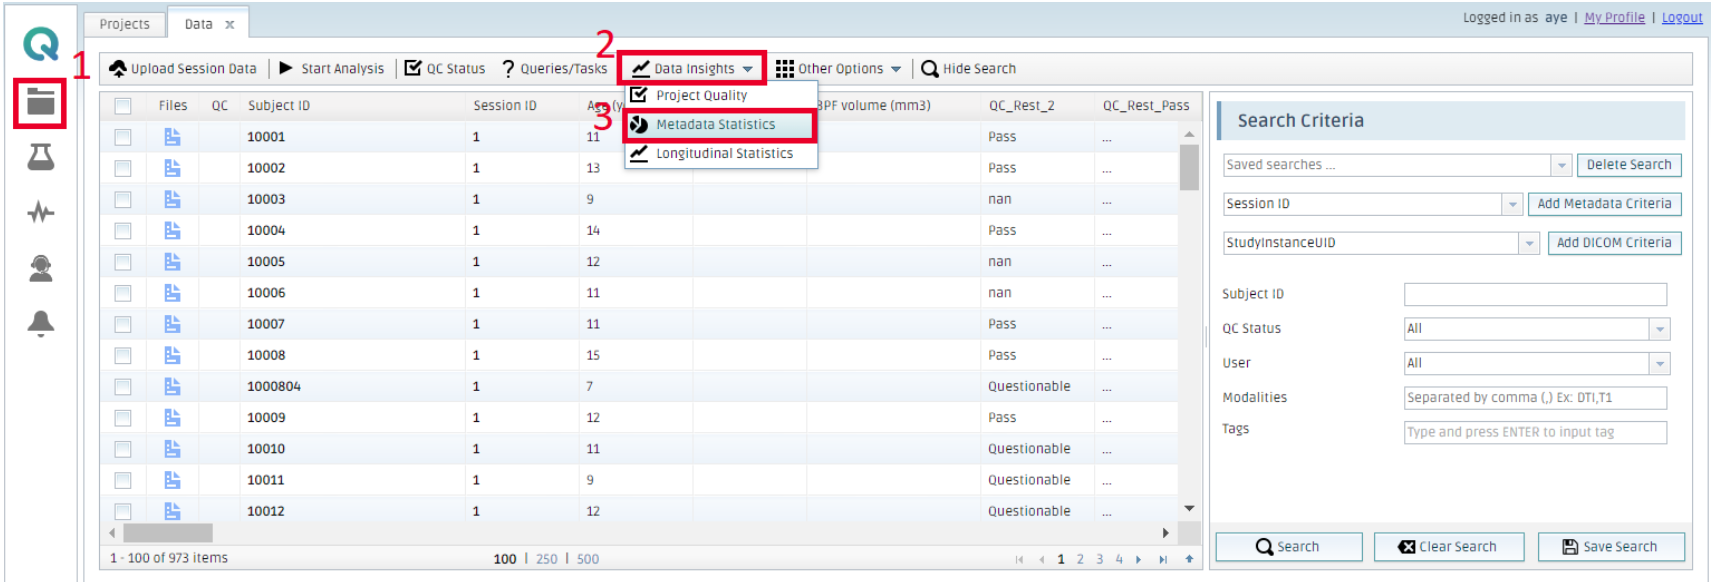
Fig. 65 The “Metadata Statistics” window can be accessed through the data view, in the “Data insights” menu.
Next, select the desired project-level metadata available in the active project to plot it. To do so select a metadata field from the “Fields” drop-down menu, and click “Add Field”.
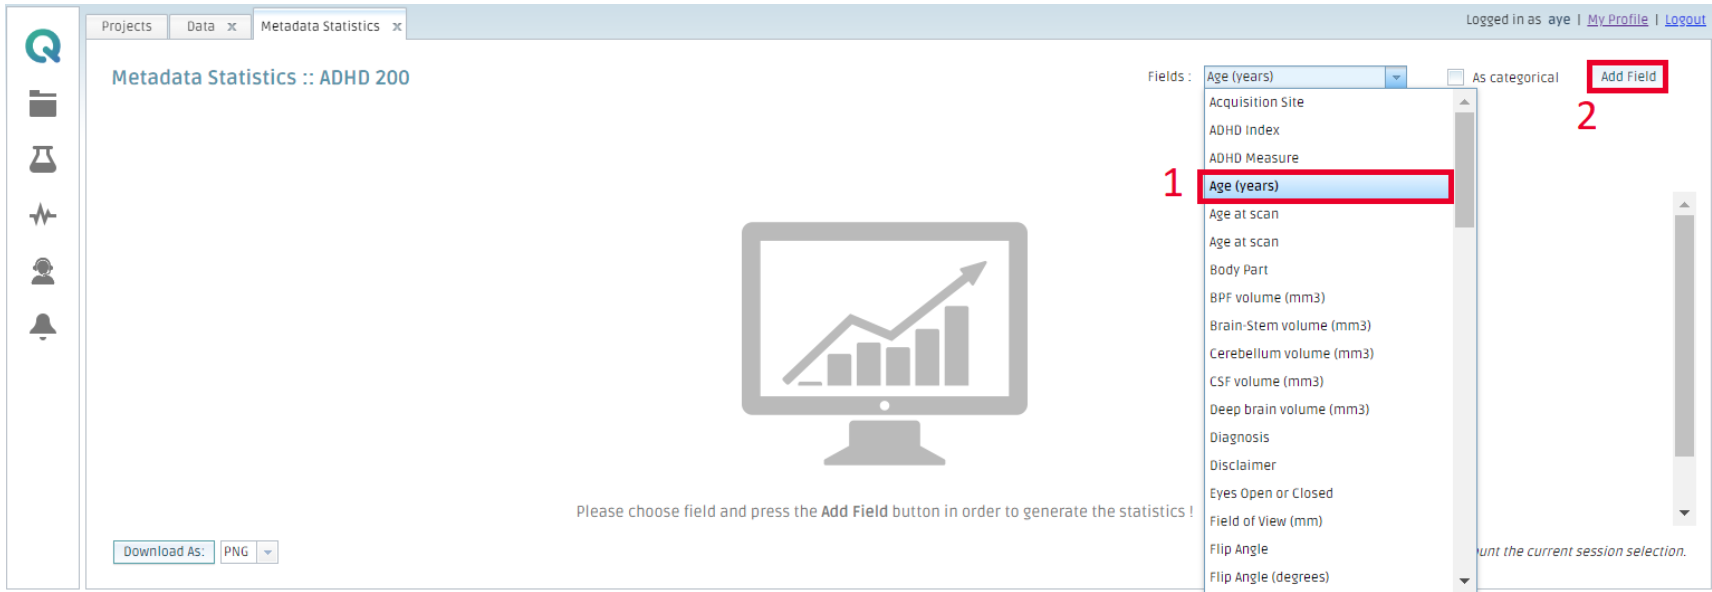
Fig. 66 Add a metadata field to the statistics.
The metadata plots will be automatically generated based on the data type. If you want to treat numerical values as categorical, check the “As categorical” check box.
The different types of plots are shown next:
Histogram: Applied to numerical metadata (Fig. 67).
Scatter plot: Applied when multiple metadata fields are selected (Fig. 68). The scatter plot is accompanied with a regression line whose computation can be linear, exponential, or polynomial. If you add more than two metadata Fields, the scatter plots for every combination of the fields are presented.
Pie-chart: Applied to categorical metadata. Allows visualization of the percentage of values in each category (Fig. 69).
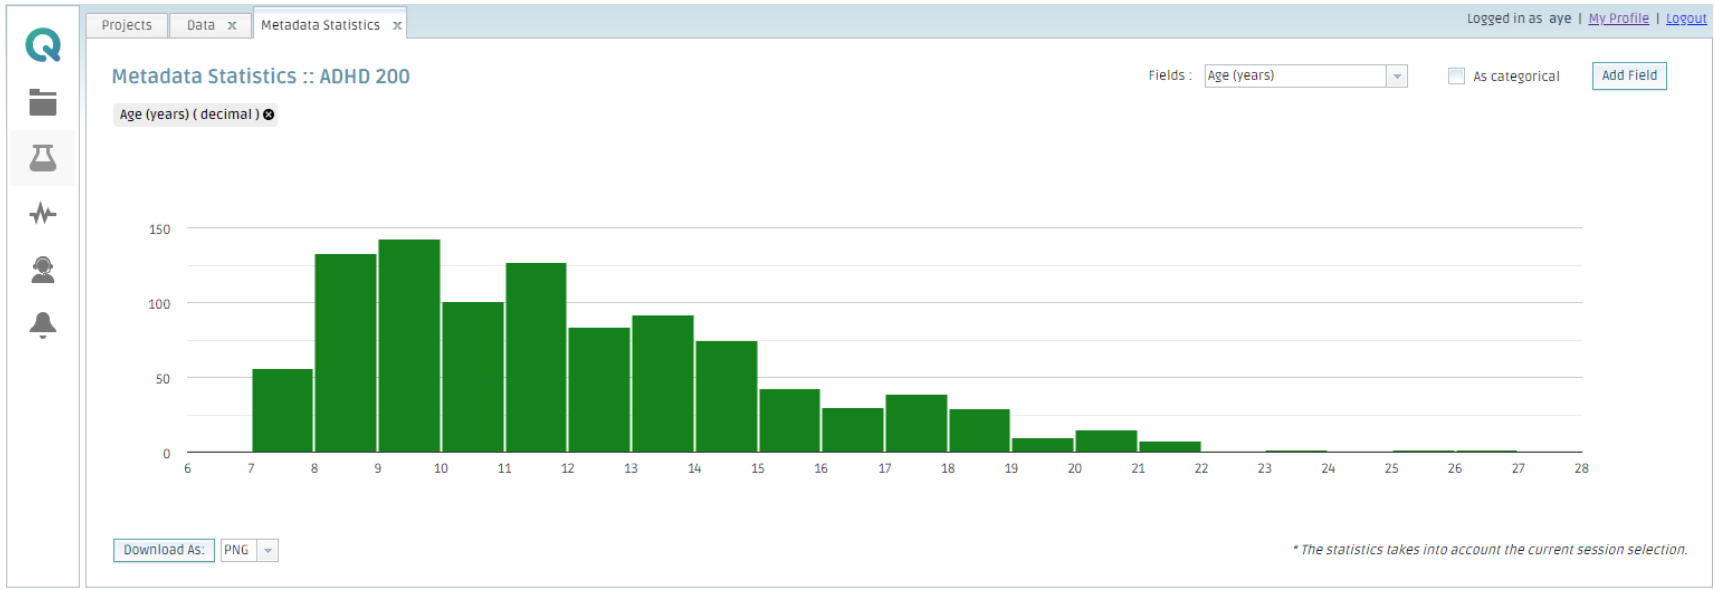
Fig. 67 Example of metadata statistics histogram.
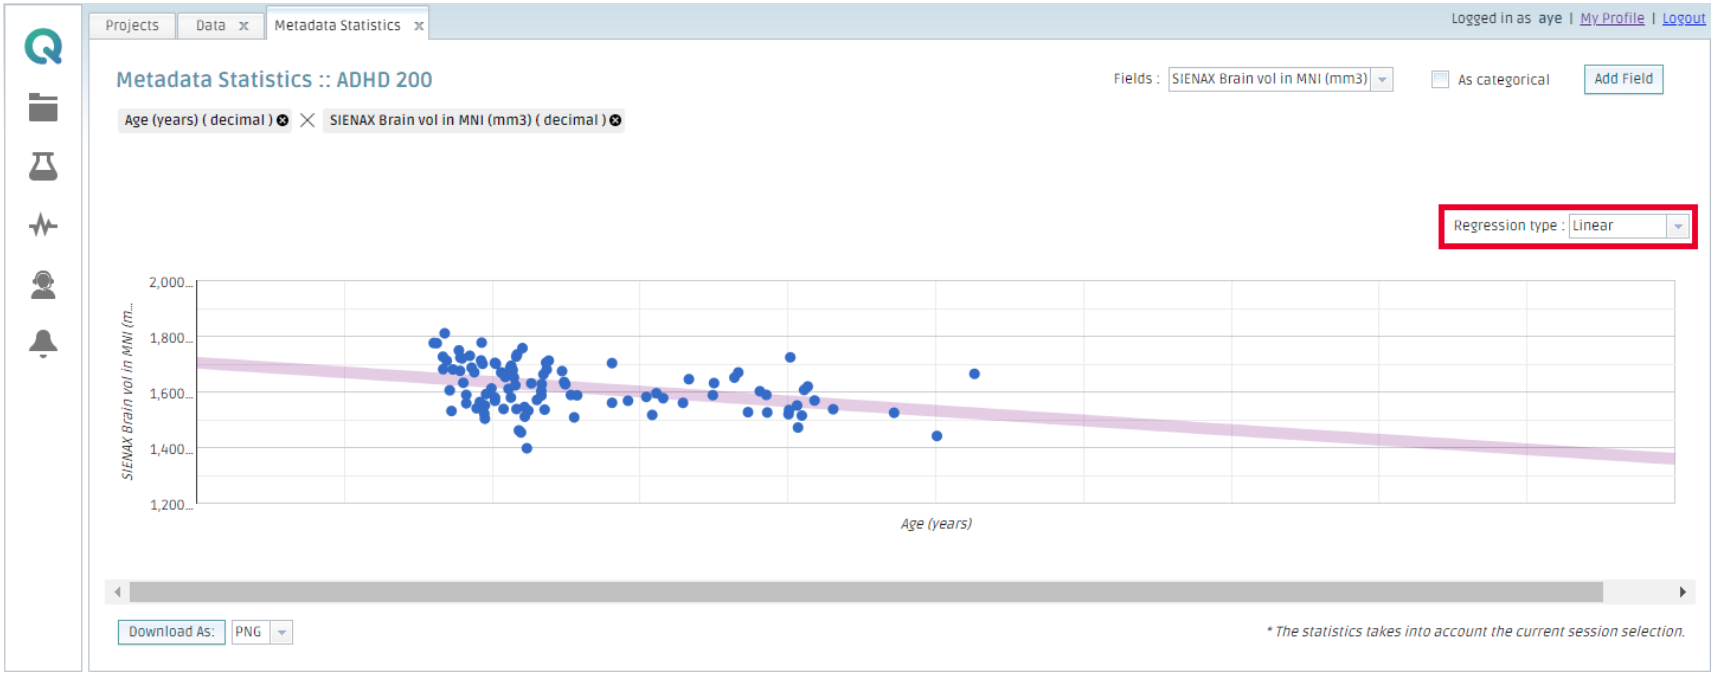
Fig. 68 Example of metadata statistics scatter plot.
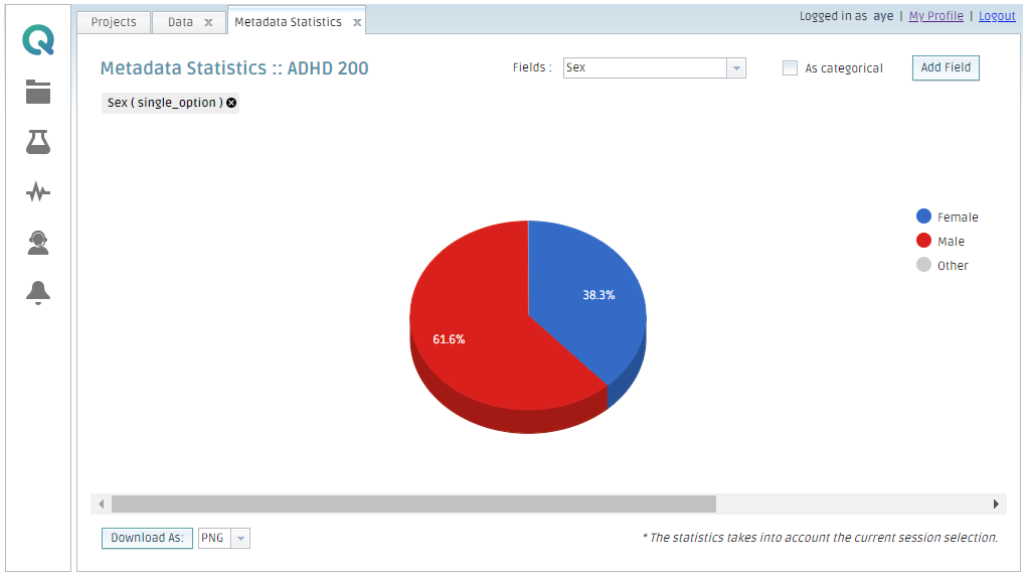
Fig. 69 Example of a pie chart.
You can download the data from any plot as an image (.png) or a spreadsheet (.csv).
Metadata statistics and the derived plots are by default extracted from all the data available in the active project. If you wish to derive plots and statistics from only a subset of the active project’s data, first perform a data search using the “Search Criteria” functionality of the “Data” tab. For more information on using the “Search Criteria” functionality, see Filtering Metadata.
Longitudinal Statistics
Medical imaging studies typically span long periods of time in order to see how the underlying structure and functions of tissues are affected by age, treatments, disease progression, or any other variables. Hence, to visualize the evolution of the project-level metadata fields over time, in the “Data” tab there is the “Data Insights -> Longitudinal statistics” tab. This tab allows you to plot the correlation between any pair of metadata fields available in the active project. The plot considers the corresponding metadata of all the sessions.
On the “Longitudinal Statistics” tab, select for each axis a metadata field from the drop-down menus and click “Show”. It is possible to define a cumulative view along the X-axis by checking the “Cumulative X” box. Next click “Show”.
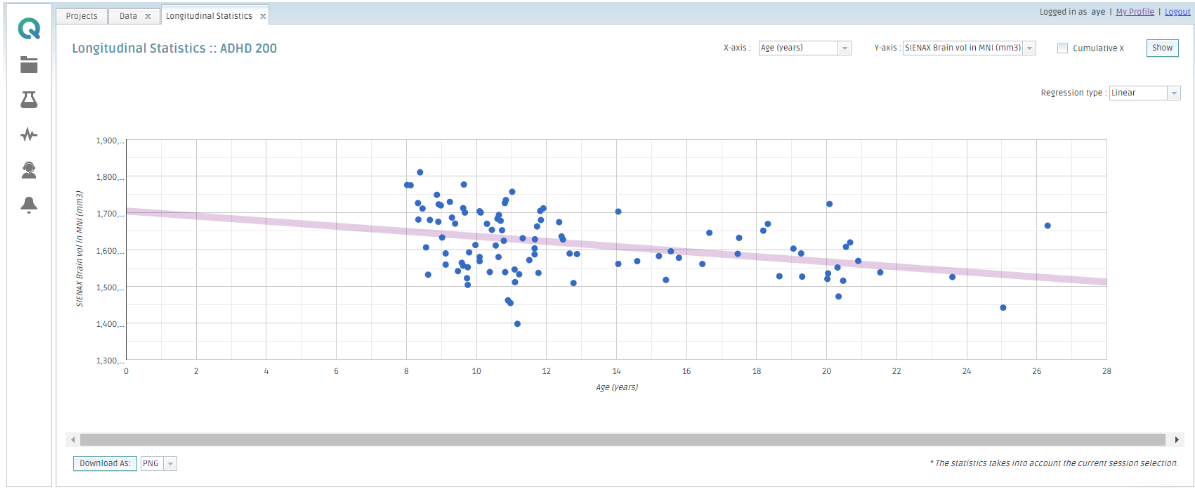
Fig. 70 Example of longitudinal statistics scatter plot and linear regression line.
A scatter plot is automatically generated Fig. 70 with a regression line which can be either linear, exponential or polynomial.
Note
The sessions used in the longitudinal statistics plots can be filtered via the “Search Criteria” in the “Data” tab as described in the final paragraph of section Metadata Statistics.
Analysis Management
Within the QMENTA Platform, the uploaded image data can be processed in order to obtain a particular set of output data, or results. The image processing tools used, whether implemented in singular units or organized into Workflows, are collectively termed analyses.
You may execute already available, in-house analyses, or integrate and execute your own. The processes involved in both of these are described below.
Starting an Analysis
To start an analysis, first go to the “Analysis” tab (Fig. 71):
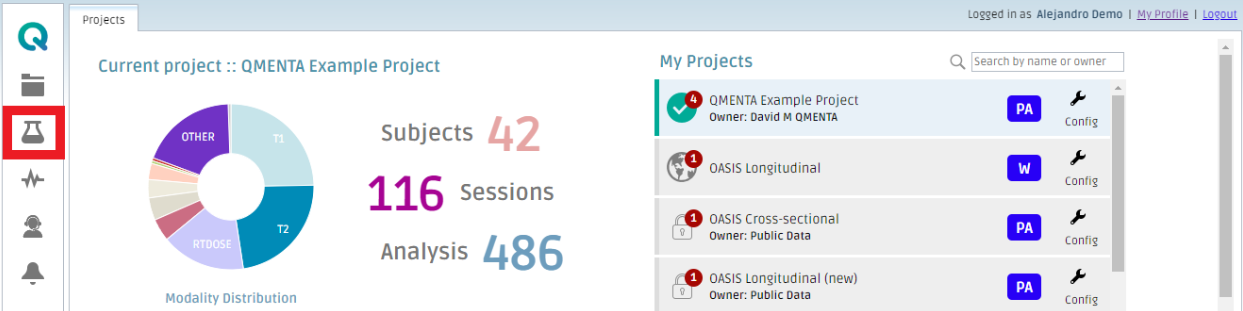
Fig. 71 Opening the “Analysis” tab by clicking the flask icon.
Click “Start Analysis” (Fig. 72):
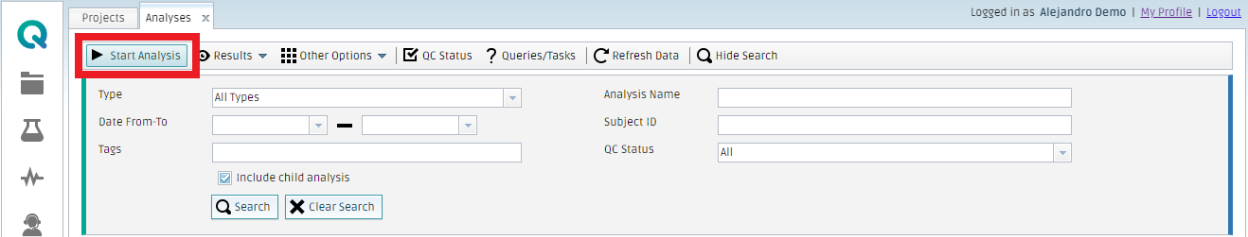
Fig. 72 “Start Analysis” button.
A pop-up window will appear on the screen (Fig. 73):
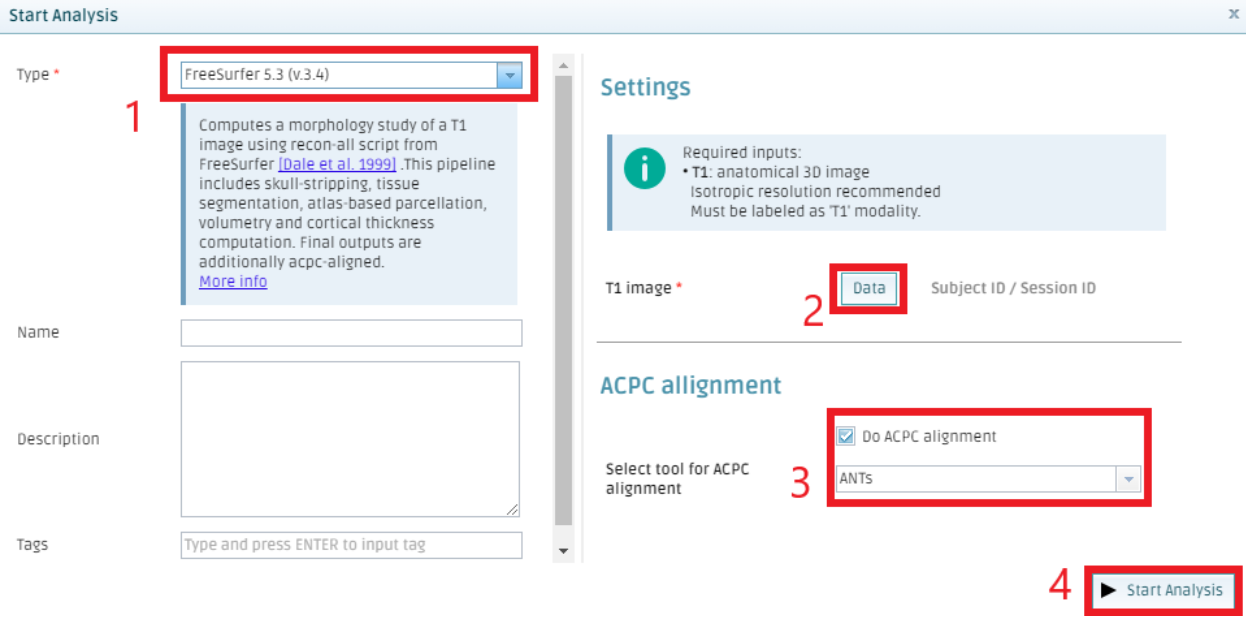
Fig. 73 “Start Analysis” pop-up window.
From within this window (Fig. 73):
Select the analysis type you want to run.
Modify the name of the analysis for that particular execution (optional).
Select the input data you want to analyze (Fig. 74).
Configure the settings to customize the analysis (optional, and if applicable).
Click “Start Analysis”.
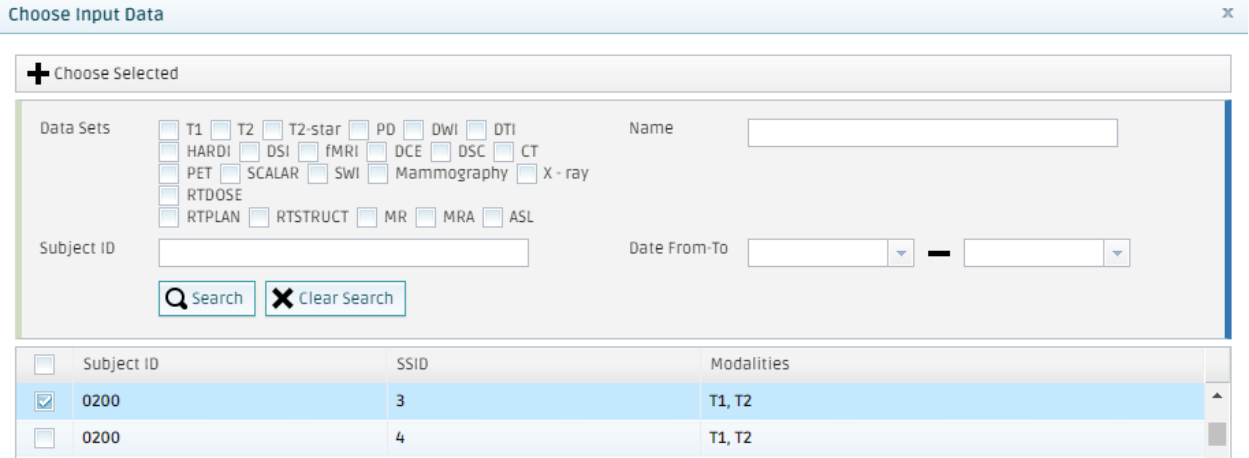
Fig. 74 Choosing input data. Use the search criteria to filter the needed Subject IDs. Next, after selecting them click on “Choose Selected”.
Alternatively, analyses can be started directly from the “Data tab” on the Dashboard (Fig. 75). Check the row of the pair Subject ID/Session ID of interest and click “Start Analysis”. By checking multiple sessions, multiple analyses can be scheduled at once. Note that, by batch starting analyses in this way, it will not be possible to customize the analysis settings to the requirements of individual data sessions should they differ.
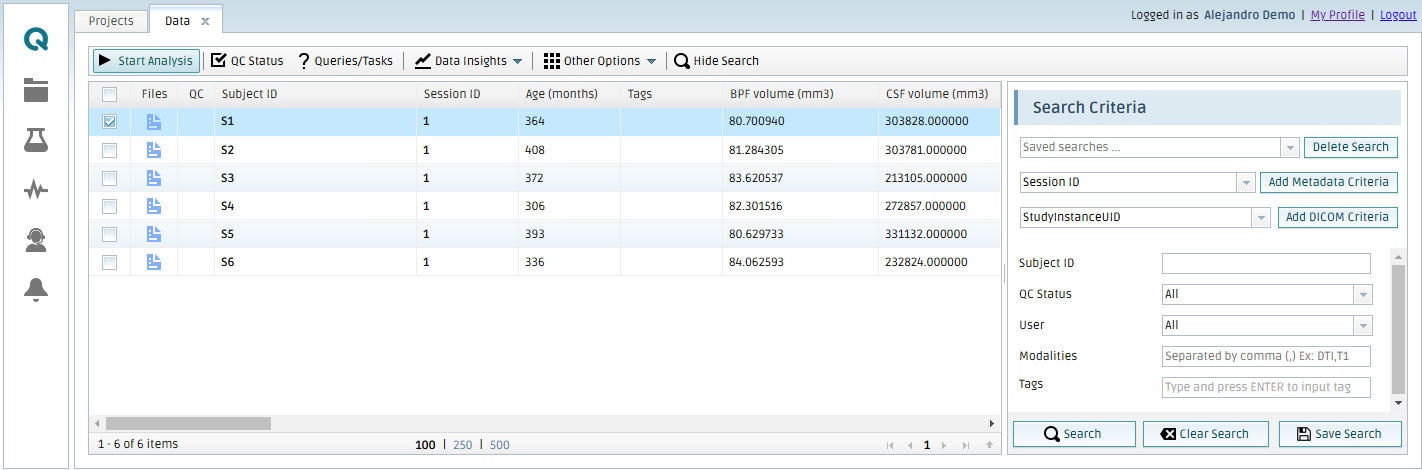
Fig. 75 Starting an analysis from the “Data” tab.
Using either of the previous approaches to start an analysis, if the data requirements for the analysis are matched by multiple files within the session a pop-up window similar to Fig. 76 will appear to facilitate selection of the desired input data.
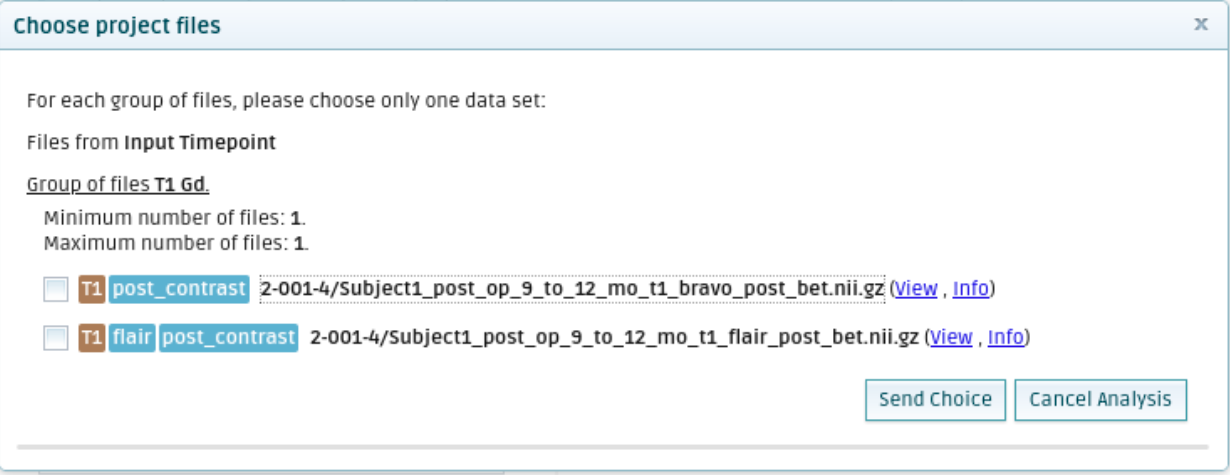
Fig. 76 “Choose project files” pop-up window used to select the desired file to be input to an analysis when there are multiple matches between the analysis input requirements and the files available in the data session.
The previous pop-up window (Fig. 76) might even appear in the cases where the input modality is optional as is the case of the analysis shown next in Fig. 77 (see T2 image modality). As explained, it is due the presence of repeated files that satisfy the input requirements of the analysis. In these cases, the selection of the “optional” input file is mandatory for the analysis to start, however, the analysis window (Fig. 77) will include a setting to indicate if those optional files are to be used as input of the analysis or not.
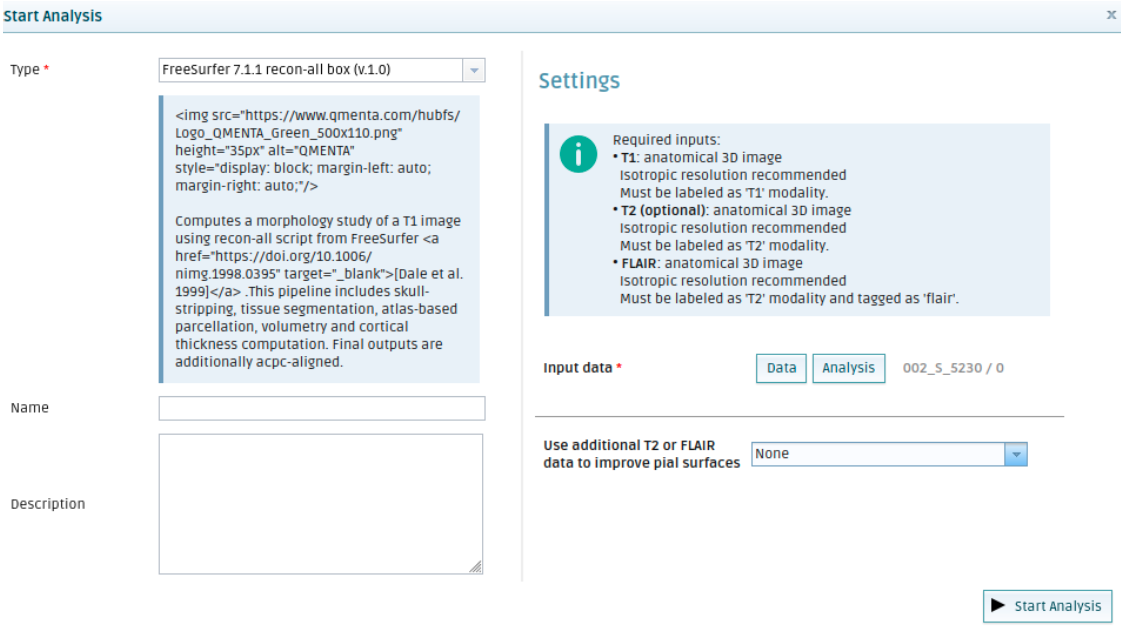
Fig. 77 Start analysis pop-up window with optional files. See T2 (optional). Below the input data, there is a drop-down that allows selection, if desired, of the optional files to be used during execution of the analysis. If non is selected, no optional file will be considered.
On the contrary, if the required data for the analysis is not present among the data available in the session a pop-up window with a warning will appear as shown in Fig. 78.
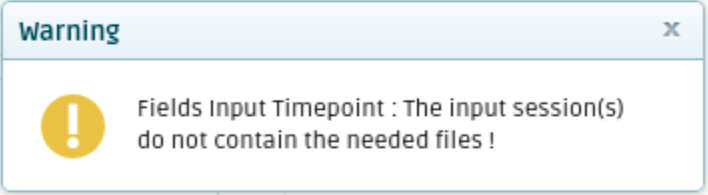
Fig. 78 Warning raised when starting an analysis using as input a data session that does not have the required files.
Note
If scheduling multiple analyses simultaneously (i.e., batch starting), the messages depicted in Fig. 76 and Fig. 78 will not appear. Additionally, should either of the two issues warranting the messages and which require user attention affect a data session within the batch list, the remaining analyses in the list after that point will NOT be scheduled. Hence, when batch starting analyses in this way, it is recommended to pay close attention to ensure that all expected analyses have been successfully scheduled. Otherwise, identify the problematic data session(s) and start the analysis individually.
The QMENTA Platform will schedule the analysis to run automatically as soon as the necessary resources are available.
The status of an analysis may be consulted in the “State” column of the “Analyses” tab (Fig. 79):
A blue triangle indicates that the analysis is still running.
A green circle indicates that the analysis has completed successfully and the results are available for viewing.
A red circle indicates that the analysis did not complete successfully.
A blue silhouette figure indicates that the analysis involves a Manual Step and is awaiting user action.
A gray circle means the analysis is pending to be executed.
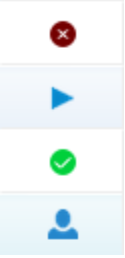
Fig. 79 Different statuses of analysis.
Automatic Analysis Triggers
While starting analyses via user-initiated point-and-click methods (Starting an Analysis) facilitates deliberate and precise control over analysis execution, the QMENTA Platform also offers the benefits of automatic analysis/es triggers.
Automatic analysis triggers can be applied in two scenarios:
Upon data upload
Once a data session is successfully uploaded to the QMENTA Platform, the Protocol Adherence Automation analysis (see section Automatic QC Status Modifications) will start automatically.
QC Status set to PASS
Whenever the QC Status of a data session is set or changed to PASS, the analysis/es will start automatically so long as the files in the data session unequivocally satisfy the required inputs of the analysis. This can apply to any analysis of choice.
It is worth indicating that the two trigger scenarios are designed to be linked; following a realistic order of events: data is uploaded, triggering the execution of the Protocol Adherence Automation analysis, which, upon finding the input data to satisfy its predefined rules, sets the QC Status to PASS, and ultimately triggers the defined analysis/es. However, using the functionality in this way is entirely up to the user’s preference. Recall that the Protocol Adherence Automation analysis may be executed at any time including outside of the context of data upload, and that the QC Status of a data session may also be set manually.
Note
To set up automatic analysis triggers in a specific project, you must contact QMENTA Support providing the list of analyses you would like to automatically trigger. These functionalities are only configurable by QMENTA personnel.
Manual Steps
After starting, some analyses require that you take additional actions before they can proceed to completion. “Manual Steps” are indicated in the “Analysis” tab by a blue silhouette figure as shown in Fig. 80.
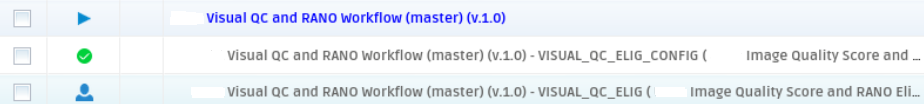
Fig. 80 Manual step analysis waiting for user action.
In order to access the Manual Step, click the blue silhouette figure. The Manual Step will open in a new tab, as shown in the Fig. 81.
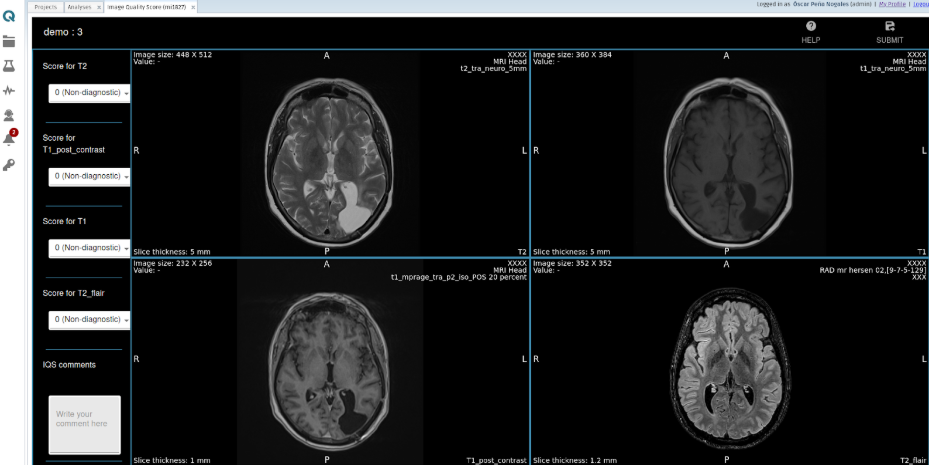
Fig. 81 Example of a Manual Step. You must submit this step for the analysis to continue.
Depending on the analysis, you can “Save” your progress and exit the Manual Step before returning at a later time. In all cases, once satisfied with the manual inputs, click “Submit” on the upper-right corner before confirming the action in the “Warning!” pop-up (Fig. 82). Thereafter, the analysis will continue to progress.
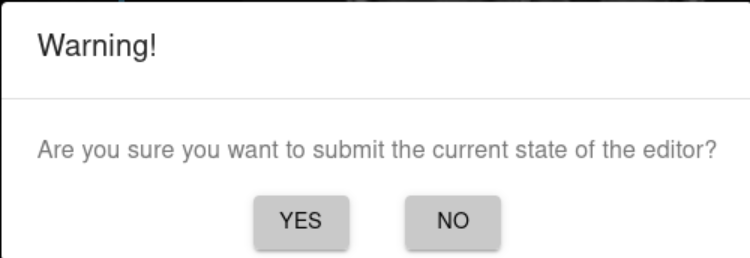
Fig. 82 Warning message that requires confirmation that the Manual Step is to be submitted. This action cannot be undone.
Example analysis types which involve a Manual Step include lesion segmentation and/or editing, visual image quality scoring and coordinate annotation.
Note
The “Save” button in a Manual Step might not be working in unsupported browsers. Refer to section System requirements for more details.
Note
In some analyses, namely some workflows, it is necessary for the QC Status of a component analysis to be defined before the workflow can proceed to the next component. This is distinct from previously explained manual steps in that the status of the analysis component will display a green circle, indicating completion, and while the overall workflow still appears to be running, the proceeding component will not be scheduled. Analyses that require this “QA” step are indicated in the workflow model by a blue circle (Fig. 83), accessible via the Analysis Information tab as shown in section Analysis Information Tab. For instructions on defining an analysis’ QC Status, see section Analysis QC.
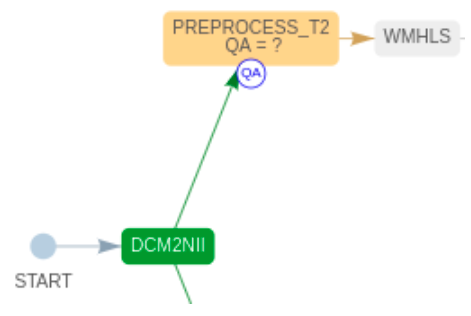
Fig. 83 The blue “QA” circle indicates analysis components of workflows in which it is necessary to define the analysis QC Status of the component before the workflow can resume.
Accessing Analysis Results
Visualizing Analysis Results
To visualize the results of a completed analysis, go to the “Analyses” tab and check the row corresponding to the analysis of interest. Ensure that only the row of the analysis of interest is selected; selecting multiple rows can open the incorrect analysis.
Go to “Results” and click “Show Results”. You can also Show Results by left-clicking over the analysis.
The results presented depend on the analysis configuration. Some analysis results will be presented in a new tab, as shown below.
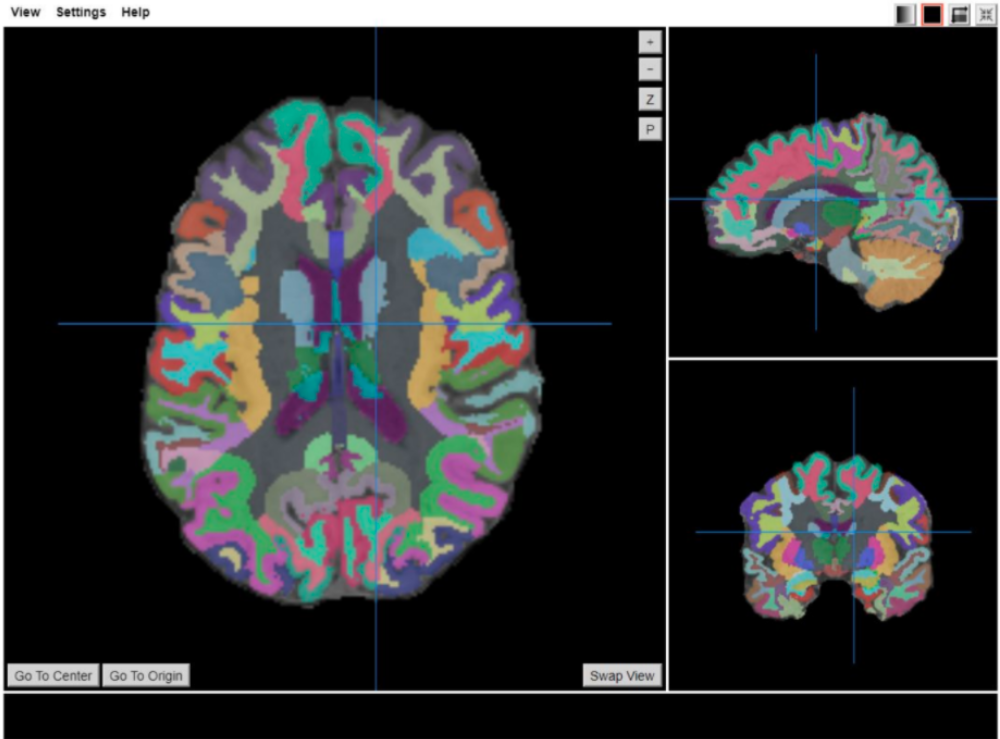
Fig. 84 Example of an analysis result. This particular case enables the visualization of the segmentations.
In other cases, a pop-up window appears listing the output result files generated. You are able to “Download Selected” files to your local computer or to “Visualize” them within the QMENTA Viewer.
The list of result files (Fig. 85) may also be accessed by again clicking “Results”, followed instead by “Result Files”.
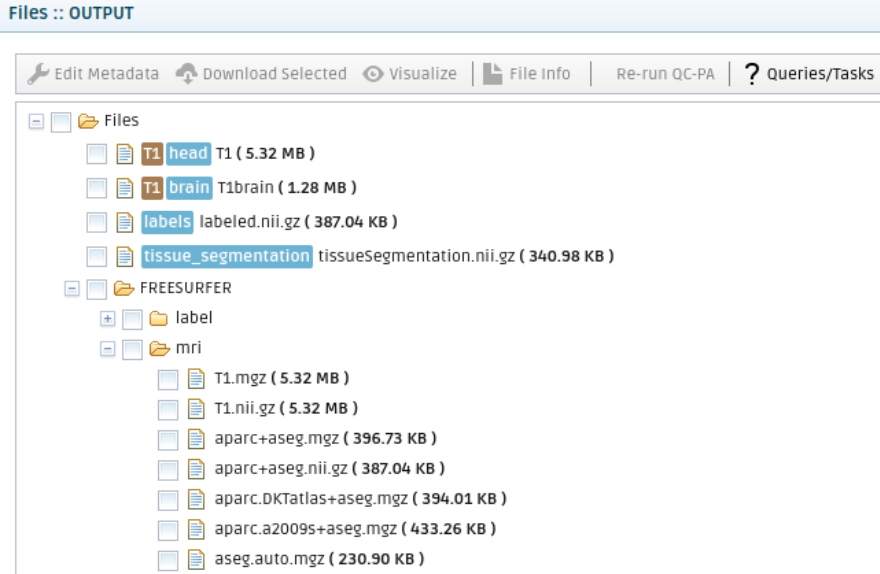
Fig. 85 List of result files of a certain analysis.
Analysis QC
If/once you have quality checked the results of an analysis, you may mark it as PASS or FAIL. This functionality facilitates search, filtering and follow-up by other study collaborators.
To set the QC Status of an analysis:
Go to the Analyses tab.
Select an analysis, click “Results” and then “Show Results”. Consider the analysis result from a quality control perspective (if applicable).
Select the analysis again and click “QC Status”. This will open the Change QC Status pop-up similar to Manual QC Status Modifications.
Select a QC Status from the dropdown list, and add the QC Comments if desired. To enact the change, click “Change”. You may consult prior changes by clicking “View Change History”.
A green check or red cross will be marked in the corresponding row of the QC column in the “Analyses” tab, indicating PASS or FAIL respectively (Fig. 86):

Fig. 86 Analysis QC Status visualization.
Note
In some analyses, specifically some workflows, it is necessary to define the QC Status of an analysis component before the next component can begin. Analyses whose state is waiting for QC will be on hold until the QC Status is defined.
Note
The percentage of analyses marked as PASS, FAIL or neither may be quickly reviewed through the Project Quality feature.
Analysis Information Tab
You can inspect the information pertaining to any analysis listed in the “Analyses” tab, regardless of its state, by going to “Results” and then “Analysis Information”. A new tab will open. The following summary information is presented:
A graphic visualization of the analysis flow if the selected analysis was a workflow.
The overall status of the analysis.
A link to view the full analysis progress, including timestamps.
The analysis name as well as the QMENTA Project in which it is executed.
The QC Status.
The input data and settings, configured when the analysis was started.
An example of the “Analysis Information” of a workflow is shown in Fig. 87:
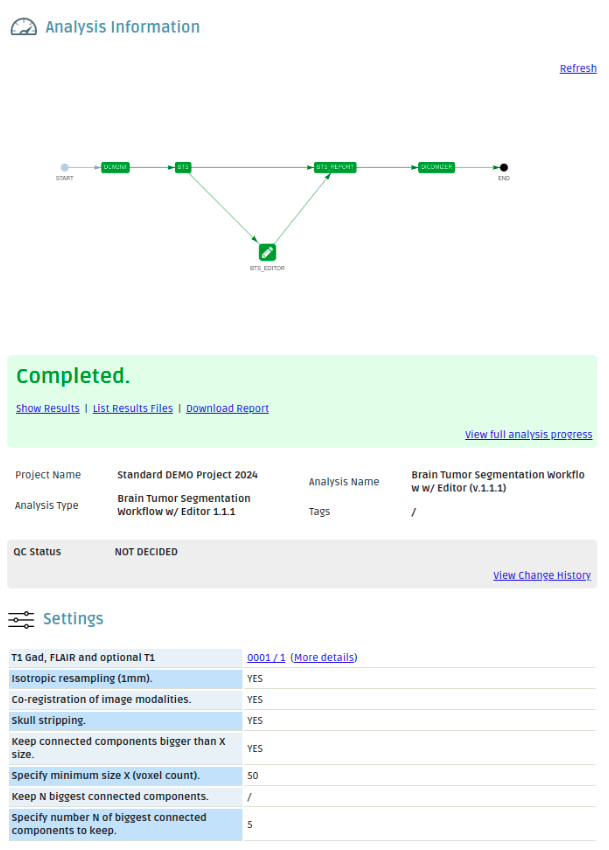
Fig. 87 Analysis information of a workflow. See the flow diagram of tools in the top.
An example of the “Analysis Information” of a tool is shown in Fig. 88:
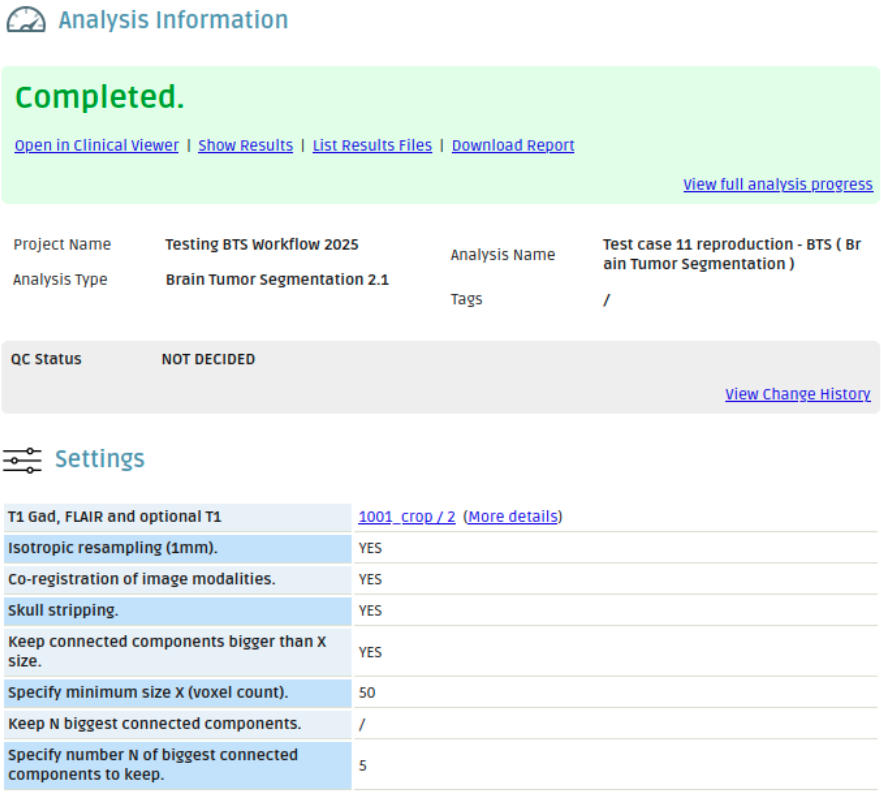
Fig. 88 Analysis information of a tool.
An example information of a failed workflow is shown in Fig. 89. You can see how the workflow is missing the “T2 flair” image to continue execution of the “LST_LPA” tool. Errors of failed tools are shown similarly.
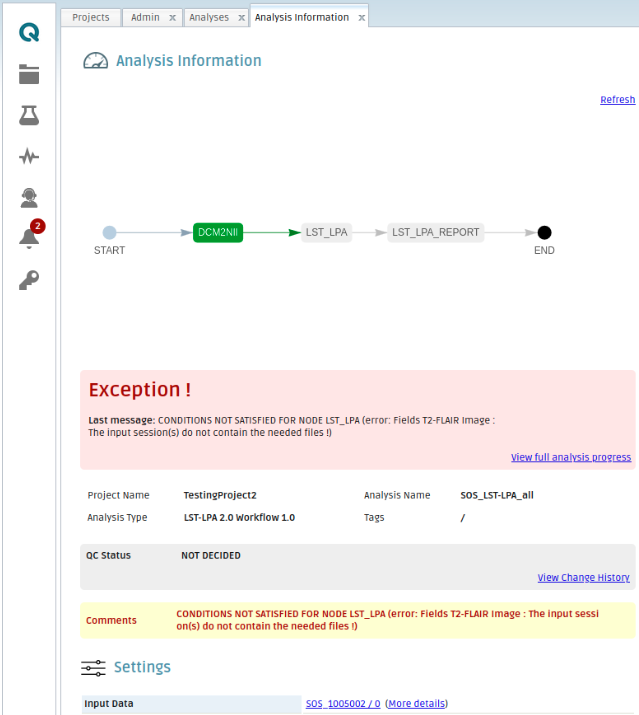
Fig. 89 Failed workflow analysis at its second tool, the LST_LPA analysis, due to missing input images.
Note
The error message shown in some analysis failures might require you to contact QMENTA’s support via support@qmenta.com for a detailed explanation.
View full analysis progress
The “View full analysis progress” button opens the pop-up window “Analysis Progress” which allows for a detailed visualization of the progress of the analysis, as shown in Fig. 90. This pop-up window also might facilitate understanding of the reason why a certain analysis failed, particularly in tools.
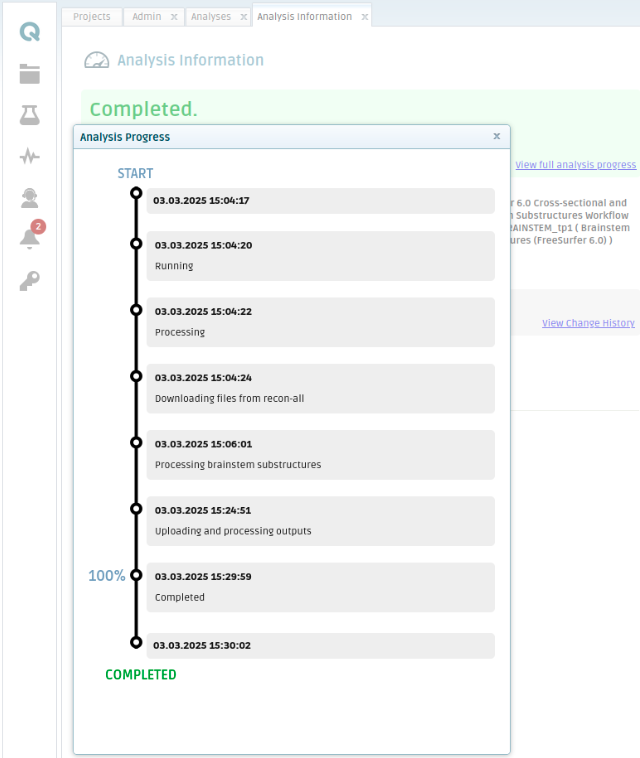
Fig. 90 Analysis progress pop-up window.
Analysis Project-level Metadata Modification
Similarly to the direct manual modification of the project-level metadata values explained in section Project-level Metadata Values Modification, analyses themselves may also modify the metadata of the corresponding Subject ID/Session ID. The metadata modified will depend on the analysis executed and it will be available in the Data tab.
Deleting an Analysis
If you wish to delete an analysis, check the row(s) of the analysis/analyses of interest. Ensure only the desired rows are checked, or you risk deleting an analysis mistakenly. Go to “Other Options” followed by “Delete Analysis”. A pop-up will appear asking for confirmation of the deletion: select “Yes” to confirm the action.
Support
If you can not find the answer you are looking for, please do not hesitate to contact us at the following email support@qmenta.com.
You can also contact us via the online chat embedded in the QMENTA Platform as shown in Fig. 91.
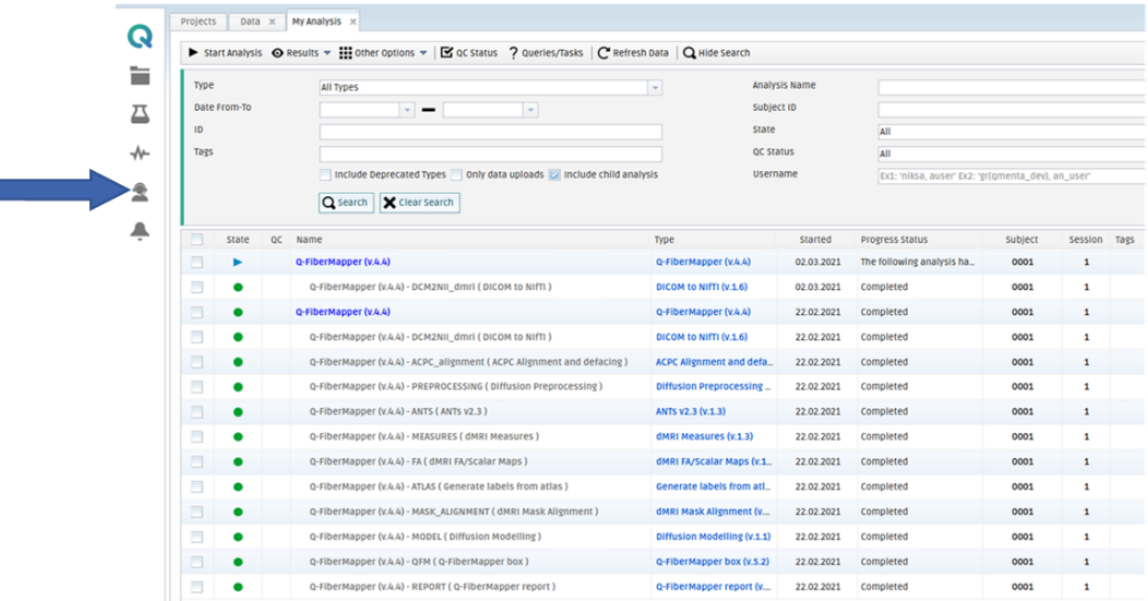
Fig. 91 Start a life chat by clicking on the highlighted icon.
You can also find further information on the QMENTA Platform and its analyses in the Knowledge Base at the following page: https://support.qmenta.com/knowledge
Copyrights
Clinical Use Notice Caution: US Federal Law restricts this device to sale by or on the order of a licensed clinician.
All Rights Reserved ©QMENTA 2018-2025
QMENTA Imaging and the QMENTA logo are registered trademarks of QMENTA Imaging S.L.
Document Changes
Version |
Release Date |
Description |
Approved by |
Changed by |
Document code |
|---|---|---|---|---|---|
1.0 |
2023-03-08 |
First release |
Patrick O’Brien |
Alejandro Riera |
DOC-0008 - QMENTA User Manual |
1.1 |
2023-03-16 |
Fixed Typos |
Patrick O’Brien |
Alejandro Riera |
DOC-0008 - QMENTA User Manual |
1.2 |
2024-10-30 |
Added My Profile section |
Alvaro Perez Moreno |
Alejandro Riera |
DOC-0008 - QMENTA User Manual |
1.3 |
2025-13-03 |
Update Content |
Kire Trivodaliev |
Alejandro Riera |
DOC-0008 - QMENTA User Manual |